
Uniform California Earthquake Rupture Forecast Maps - 2007

Detailed Description
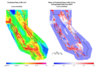
Map on the left shows the expected number of M • 6.5 hypocenters in 0.1º × 0.1º bins in a 5- year period, predicted by Earthquake Rate Model 2.3. Map on the right shows the ratio obtained by dividing this expected value by the number of M • 6.5 events extrapolated from the expected number of M • 5.0 events using a b-value of 0.8. The hot colors on the right therefore indicate areas that have a greater number of M • 6.5 events than predicted by the Gutenberg-Richter distribution; i.e., these areas contribute to the “bulge” discussed in the text. Cascadia is not included. (Fig 19 from USGS Open-File Report 2007-1437)
Sources/Usage
Public Domain.
Related
Improvements to the Third Uniform California Earthquake Rupture Forecast ETAS Model (UCERF3‐ETAS) Improvements to the Third Uniform California Earthquake Rupture Forecast ETAS Model (UCERF3‐ETAS)
We describe recent improvements to the Third Uniform California Earthquake Rupture Forecast ETAS Model (UCERF3‐ETAS), which continues to represent our most advanced and complete earthquake forecast in terms of relaxing segmentation assumptions and representing multifault ruptures, elastic‐rebound effects, and spatiotemporal clustering (the latter to represent aftershocks and otherwise...
Authors
Edward H. Field, Kevin R. Milner, Morgan T. Page, William H. Savran, Nicholas van der Elst
A synoptic view of the Third Uniform California Earthquake Rupture Forecast (UCERF3) A synoptic view of the Third Uniform California Earthquake Rupture Forecast (UCERF3)
Probabilistic forecasting of earthquake‐producing fault ruptures informs all major decisions aimed at reducing seismic risk and improving earthquake resilience. Earthquake forecasting models rely on two scales of hazard evolution: long‐term (decades to centuries) probabilities of fault rupture, constrained by stress renewal statistics, and short‐term (hours to years) probabilities of...
Authors
Edward H. Field, Thomas H. Jordan, Morgan T. Page, Kevin R. Milner, Bruce E. Shaw, Timothy E. Dawson, Glenn Biasi, Thomas E. Parsons, Jeanne L. Hardebeck, Andrew J. Michael, Ray J. Weldon, Peter M. Powers, Kaj M. Johnson, Yuehua Zeng, Peter Bird, Karen Felzer, Nicholas van der Elst, Christopher Madden, Ramon Arrowsmith, Maximillan J. Werner, Wayne R. Thatcher
A spatiotemporal clustering model for the Third Uniform California Earthquake Rupture Forecast (UCERF3‐ETAS): Toward an operational earthquake forecast A spatiotemporal clustering model for the Third Uniform California Earthquake Rupture Forecast (UCERF3‐ETAS): Toward an operational earthquake forecast
We, the ongoing Working Group on California Earthquake Probabilities, present a spatiotemporal clustering model for the Third Uniform California Earthquake Rupture Forecast (UCERF3), with the goal being to represent aftershocks, induced seismicity, and otherwise triggered events as a potential basis for operational earthquake forecasting (OEF). Specifically, we add an epidemic‐type...
Authors
Edward H. Field, Kevin R. Milner, Jeanne L. Hardebeck, Morgan T. Page, Nicholas van der Elst, Thomas H. Jordan, Andrew J. Michael, Bruce E. Shaw, Maximillan J. Werner
Long‐term time‐dependent probabilities for the third Uniform California Earthquake Rupture Forecast (UCERF3) Long‐term time‐dependent probabilities for the third Uniform California Earthquake Rupture Forecast (UCERF3)
The 2014 Working Group on California Earthquake Probabilities (WGCEP 2014) presents time-dependent earthquake probabilities for the third Uniform California Earthquake Rupture Forecast (UCERF3). Building on the UCERF3 time-independent model, published previously, renewal models are utilized to represent elastic-rebound-implied probabilities. A new methodology has been developed that...
Authors
Edward H. Field, Glenn P. Biasi, Peter Bird, Timothy E. Dawson, Karen R. Felzer, David A. Jackson, Kaj M. Johnson, Thomas H. Jordan, Christopher Madden, Andrew J. Michael, Kevin Milner, Morgan T. Page, Thomas E. Parsons, Peter Powers, Bruce E. Shaw, Wayne R. Thatcher, Ray J. Weldon, Yuehua Zeng
Uniform California earthquake rupture forecast, version 3 (UCERF3): the time-independent model Uniform California earthquake rupture forecast, version 3 (UCERF3): the time-independent model
In this report we present the time-independent component of the Uniform California Earthquake Rupture Forecast, Version 3 (UCERF3), which provides authoritative estimates of the magnitude, location, and time-averaged frequency of potentially damaging earthquakes in California. The primary achievements have been to relax fault segmentation assumptions and to include multifault ruptures...
Authors
Edward H. Field, Glenn P. Biasi, Peter Bird, Timothy E. Dawson, Karen R. Felzer, David D. Jackson, Kaj M. Johnson, Thomas H. Jordan, Christopher Madden, Andrew J. Michael, Kevin R. Milner, Morgan T. Page, Thomas Parsons, Peter M. Powers, Bruce E. Shaw, Wayne R. Thatcher, Ray J. Weldon, Yuehua Zeng
Uniform California earthquake rupture forecast, version 2 (UCERF 2) Uniform California earthquake rupture forecast, version 2 (UCERF 2)
The 2007 Working Group on California Earthquake Probabilities (WGCEP, 2007) presents the Uniform California Earthquake Rupture Forecast, Version 2 (UCERF 2). This model comprises a time-independent (Poisson-process) earthquake rate model, developed jointly with the National Seismic Hazard Mapping Program and a time-dependent earthquake-probability model, based on recent earthquake rates...
Authors
E. H. Field, T. E. Dawson, K.R. Felzer, A.D. Frankel, V. Gupta, T.H. Jordan, T. Parsons, M.D. Petersen, R.S. Stein, R. J. Weldon, C.J. Wills