
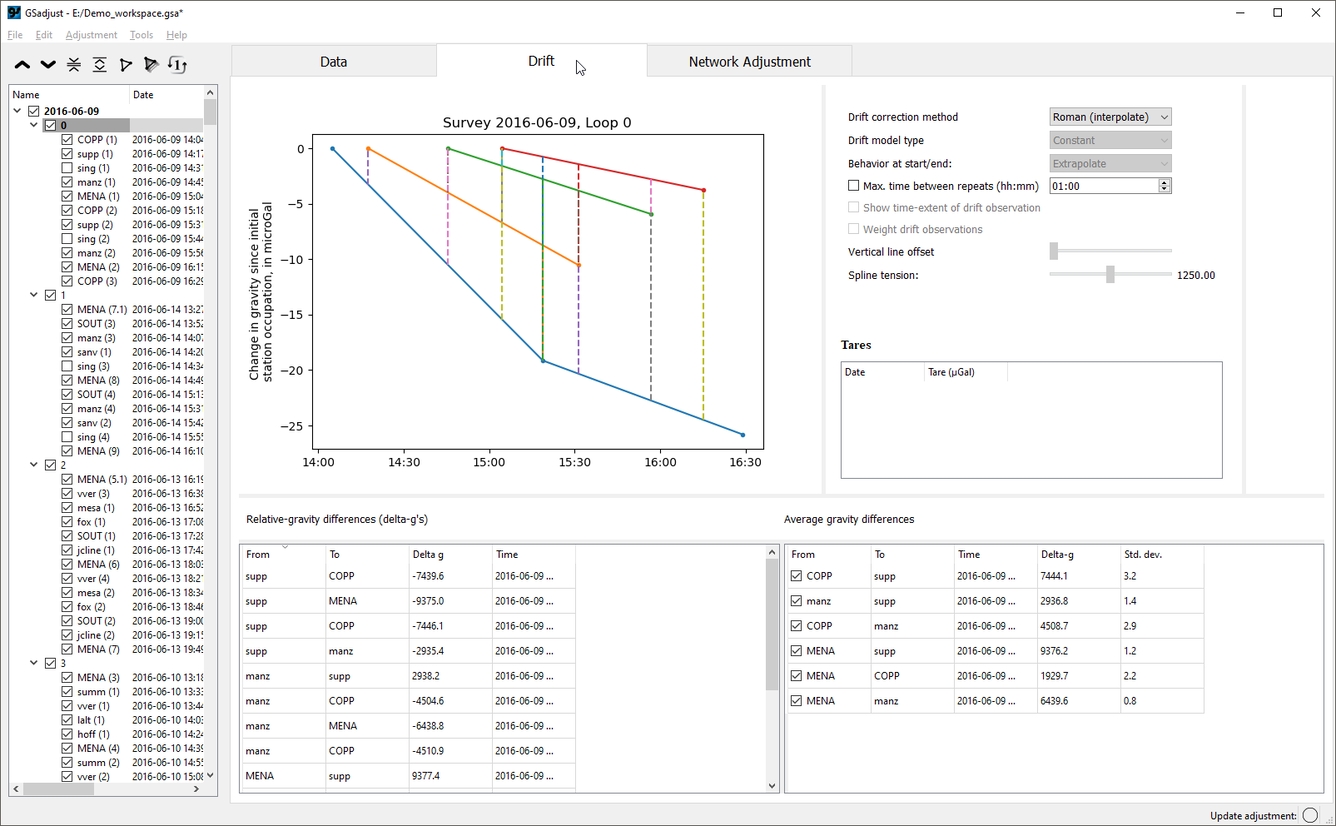
Screenshot of the GSadjust drift correction window
Detailed Description
Screenshot showing example of GSadjust drift correction window. A time-series plot shows the relative gravity change at each station (one plotted line per station), and the drift corrections evaluated using the Roman method. Controls at the right of the window control the drift correction method, and the data included in the analysis. There is a window showing tares (blank in this example). At the bottom of the window, two tables show all possible gravity differences calculated using the Roman method, and the average gravity difference between any two stations.
Sources/Usage
Public Domain.