
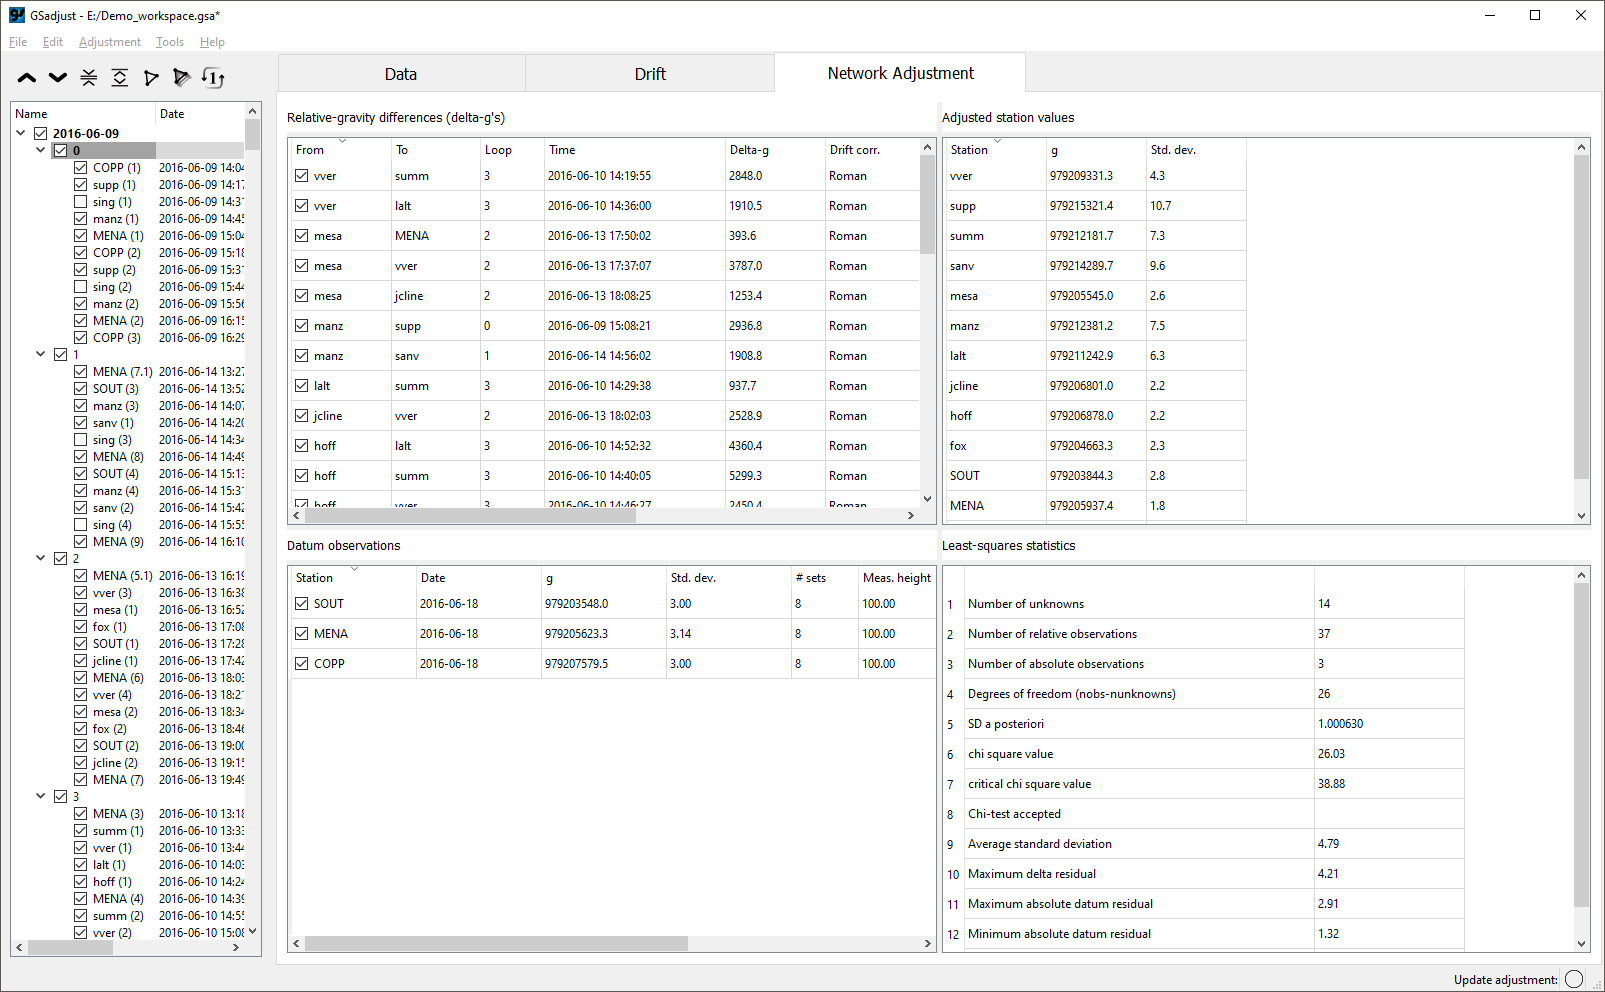
Screenshot of the GSadjust network adjustment window

Detailed Description
GSadjust screenshot showing the network adjustment window. Four tables are present. The top left table shows the relative-gravity differences used in the adjustment. The bottom left table shows the datum observations. The top right shows the adjusted station gravity values. The bottom right table shows the adjustment statistics, including a posteriori standard deviation and chi-test results.
Sources/Usage
Public Domain.