
Western Iowa Loess Records
By Ecosystems Land Change Science Program
2013 (approx.)

Detailed Description
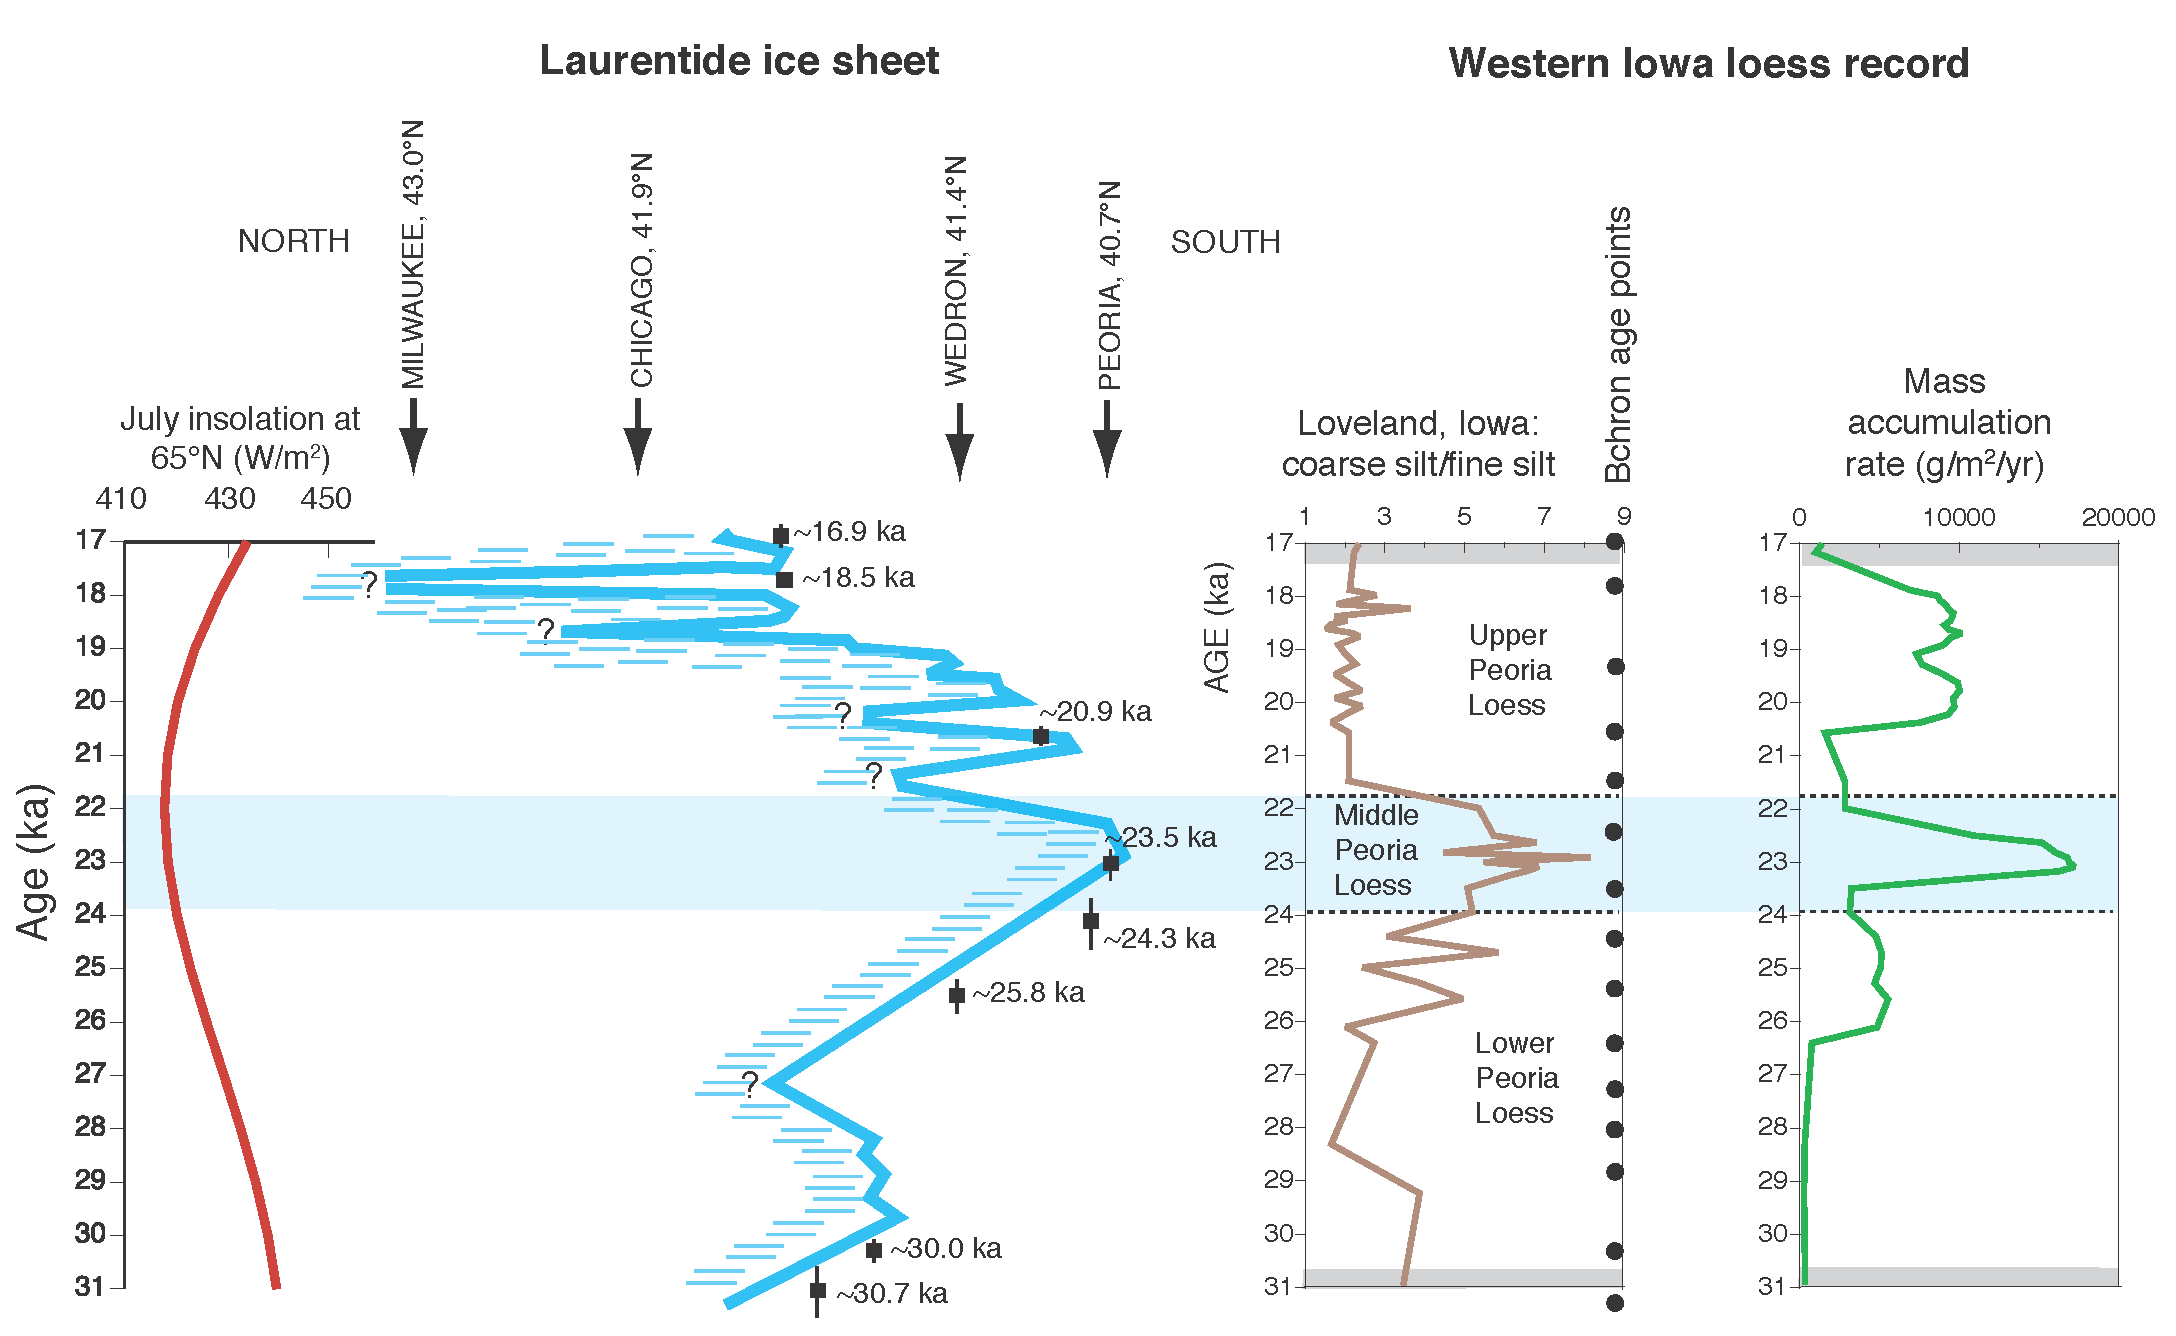
Left to right: insolation from 31 ka to 17 ka at the top of the atmosphere at 65°N in July (from Berger and Loutre, 1991); time–distance diagram showing the southerly extent of the Laurentide ice sheet in the mid-continent of North America from ~31 cal ka BP to ~17 cal ka BP (redrawn from Johnson et al., 1997; their radiocarbon ages converted to calendar-year ages using Fairbanks et al. (2005)); stratigraphy, coarse/fine silt ratios in loess at Loveland, Iowa (particle size data from Muhs and Bettis (2000)); and loess mass accumulation rates (green line) at Loveland, calculated using a Bayesian reconstruction of OSL ages based on the 15 points (solid circles) shown.
Sources/Usage
Public Domain.