
High-definition image of galena specimen showing crystal faces and silvery-gray color.
Images
Images from the Geology, Energy and Minerals Mission Area
Filter Total Items: 548
Galena Specimen 2
High-definition image of galena specimen showing crystal faces and silvery-gray color.
Galena and Chalcopyrite Specimen 2
USGS mineral specimen featuring galena and chalcopyrite. High-definition image showing metallic textures and color contrast.
USGS mineral specimen featuring galena and chalcopyrite. High-definition image showing metallic textures and color contrast.
Garnierite Specimen 2
Isolated garnierite specimen from the USGS mineral collection. High-definition image showing green coloration and earthy texture.
Isolated garnierite specimen from the USGS mineral collection. High-definition image showing green coloration and earthy texture.
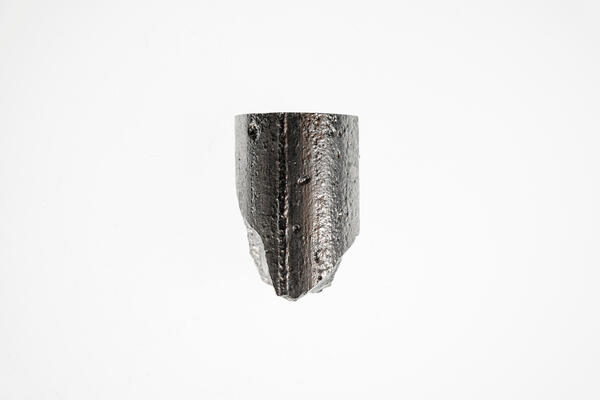
Hafnium Crystal Bar
High-definition image of hafnium crystal bar showing shiny surface and refined structure.
High-definition image of hafnium crystal bar showing shiny surface and refined structure.
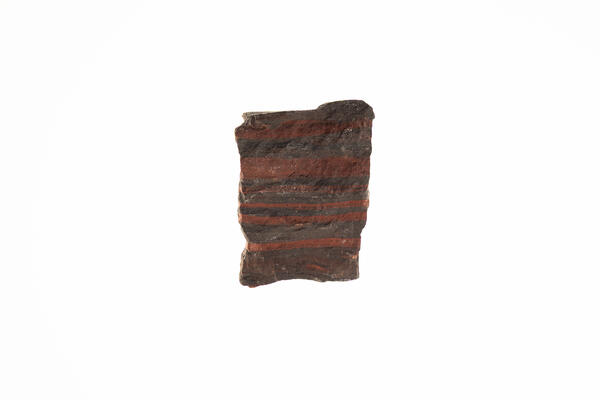
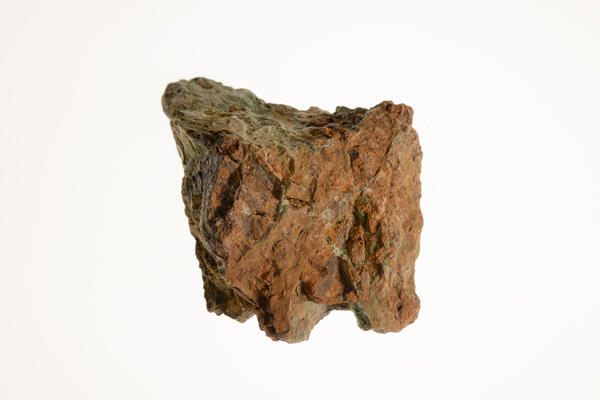
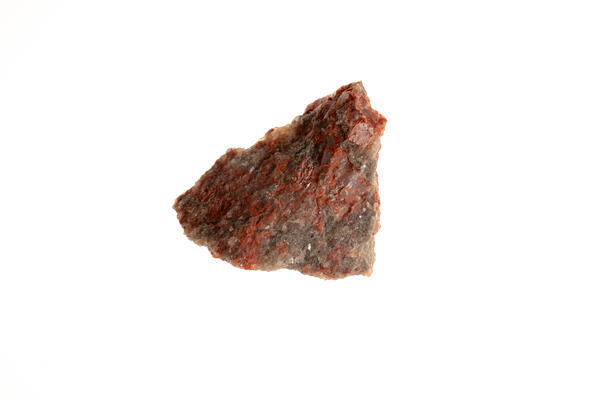
Iron Ore – Hematite
USGS mineral specimen of hematite iron ore. High-definition image showing dense texture and reddish-black coloration.
USGS mineral specimen of hematite iron ore. High-definition image showing dense texture and reddish-black coloration.
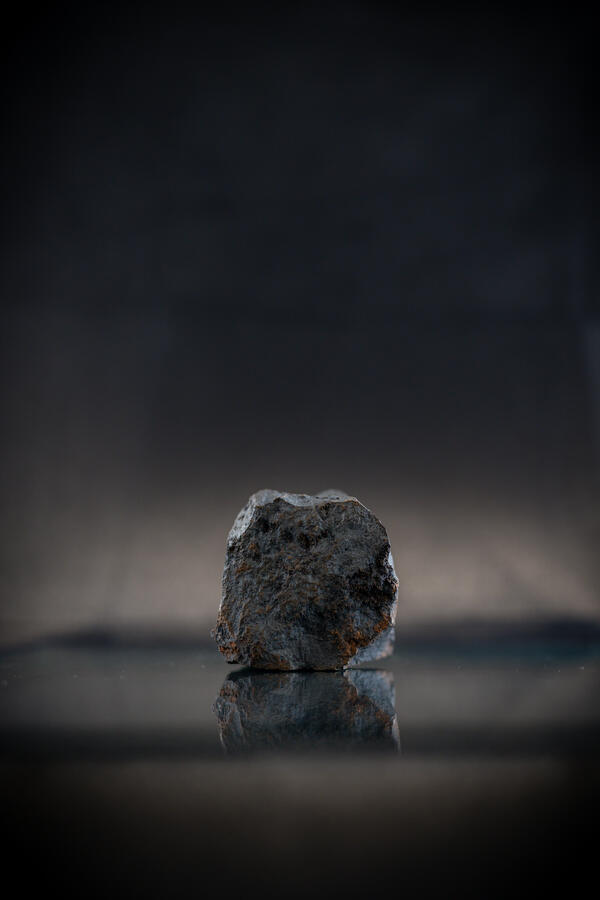
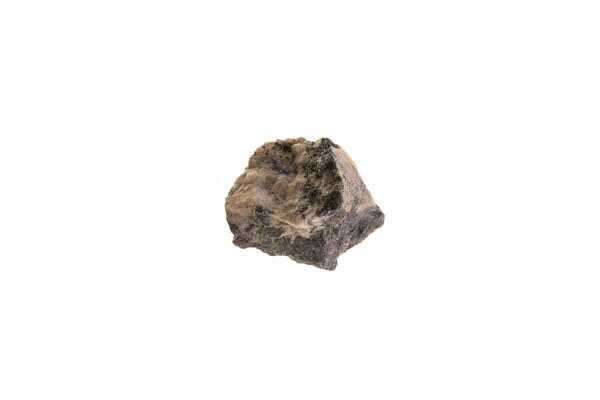
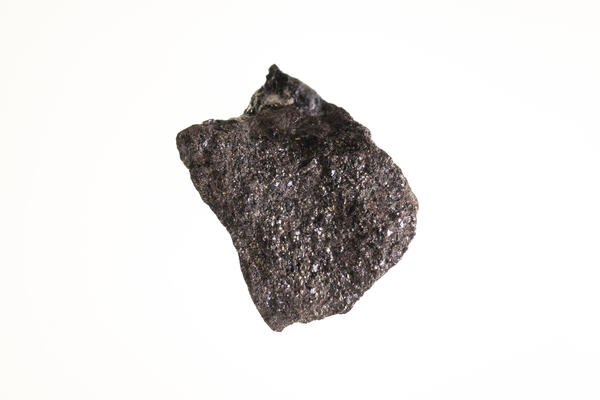
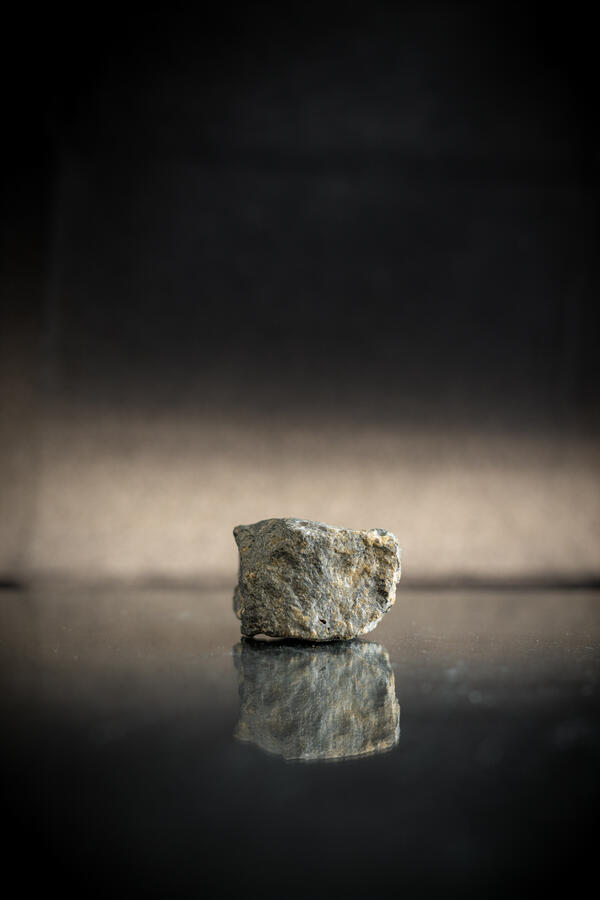
Manganese Sample
Isolated manganese specimen from the USGS mineral collection. High-definition image showing metallic texture and dark gray color.
Isolated manganese specimen from the USGS mineral collection. High-definition image showing metallic texture and dark gray color.
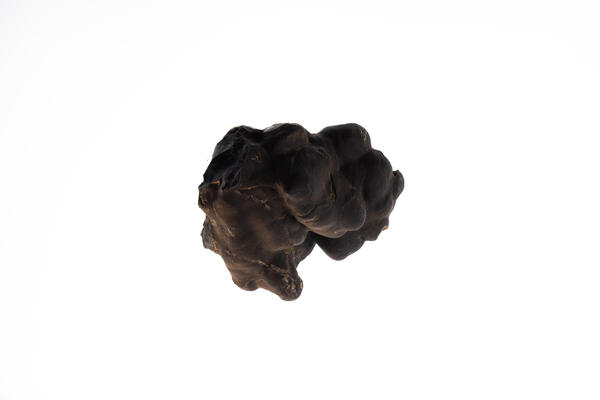
Manganese Nodule
USGS mineral specimen of manganese nodule. High-definition image showing rounded structure and layered texture.
USGS mineral specimen of manganese nodule. High-definition image showing rounded structure and layered texture.
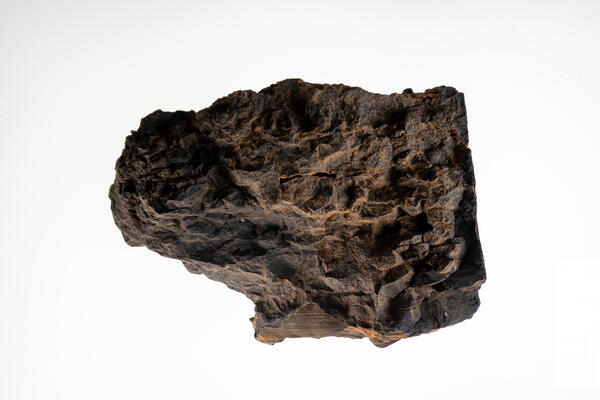
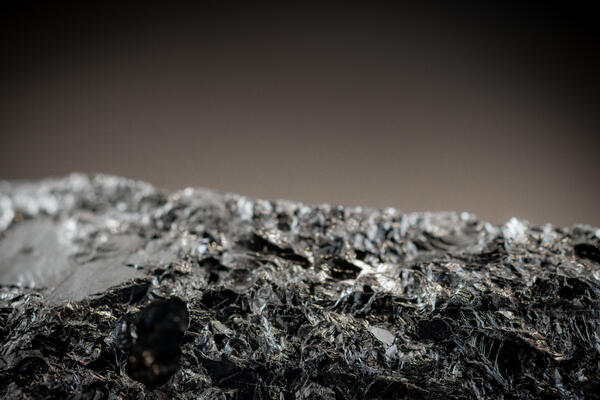
Pyrolusite (Manganese Ore) 1
Isolated pyrolusite specimen from the USGS mineral collection. High-definition image showing fibrous texture and metallic luster.
Isolated pyrolusite specimen from the USGS mineral collection. High-definition image showing fibrous texture and metallic luster.
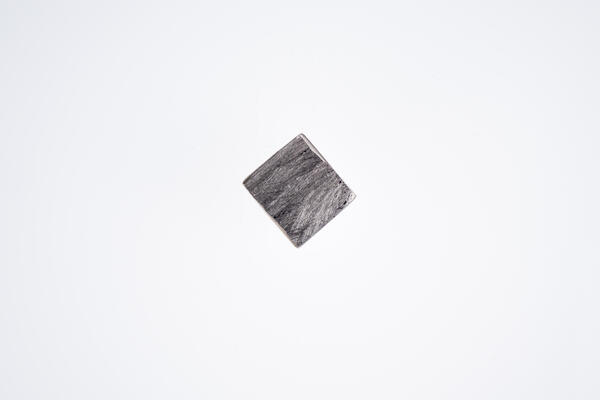
Molybdenite Specimen 2
High-definition image of molybdenite specimen with silvery luster and flaky structure.
High-definition image of molybdenite specimen with silvery luster and flaky structure.
Aluminum 2
High-definition image of an isolated aluminum specimen with smooth surface and subtle oxidation.
High-definition image of an isolated aluminum specimen with smooth surface and subtle oxidation.

Barite Crystal 4
High-definition image of barite specimen with fibrous structure and pale yellow color.
High-definition image of barite specimen with fibrous structure and pale yellow color.
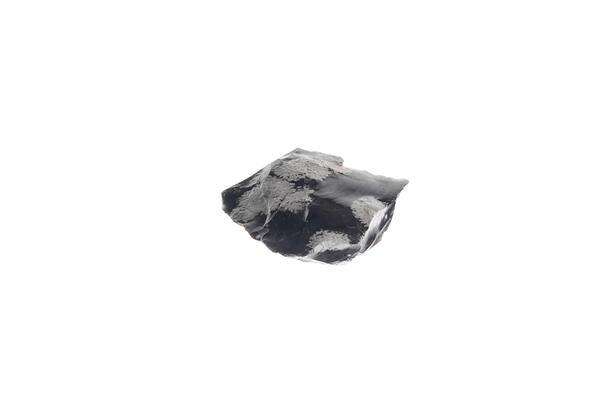
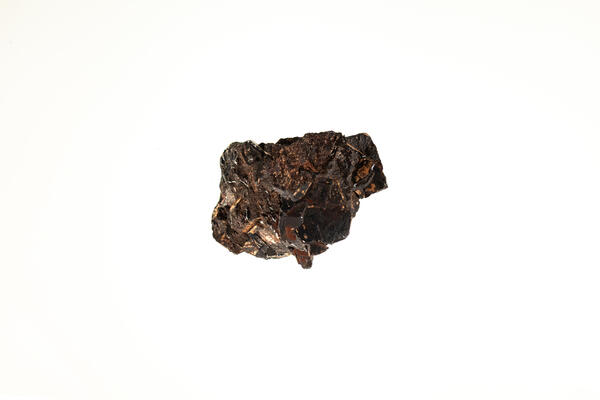
Volcanic Glass (Obsidian)
USGS mineral specimen of volcanic glass. High-definition image showing smooth texture and dark coloration.
USGS mineral specimen of volcanic glass. High-definition image showing smooth texture and dark coloration.
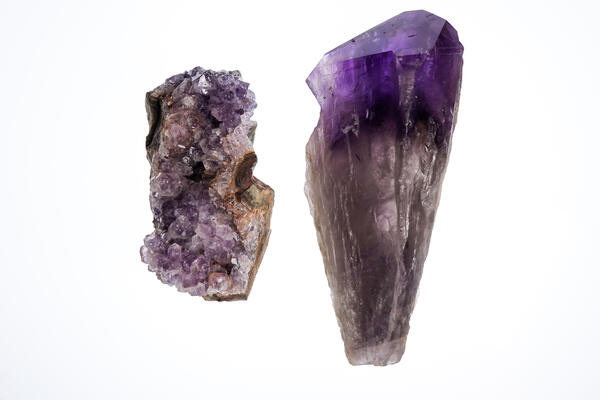
Quartz Group Sample
Group of quartz specimens from the USGS mineral collection. High-definition image showing varied crystal forms and textures.
Group of quartz specimens from the USGS mineral collection. High-definition image showing varied crystal forms and textures.
Silicon Metal Macro View
Macro image of silicon metal specimen showing detailed texture and metallic surface.
Macro image of silicon metal specimen showing detailed texture and metallic surface.
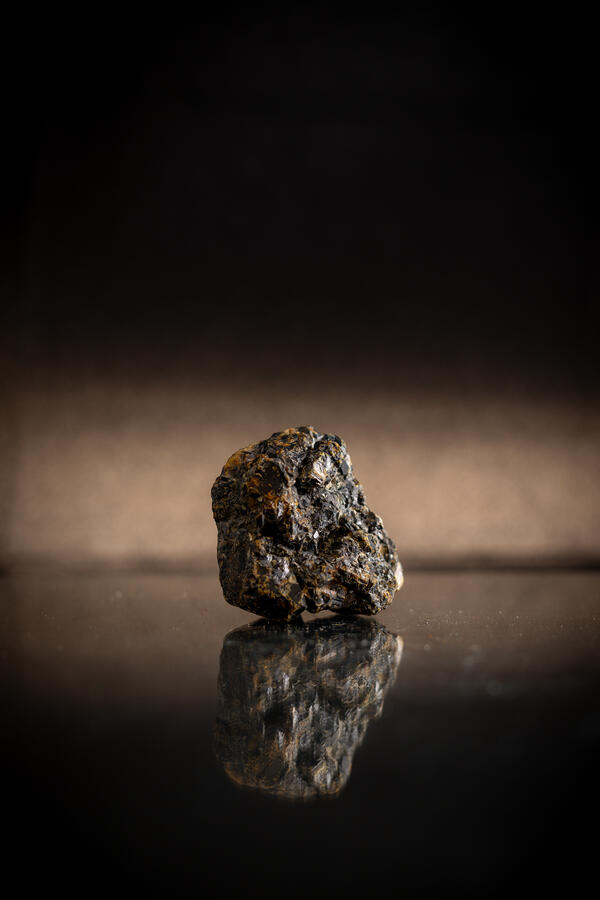
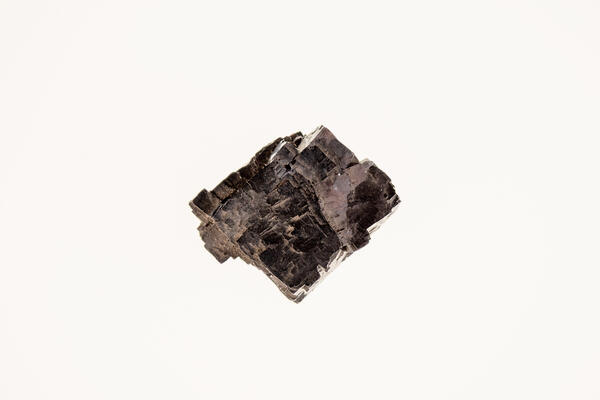
Sphalerite Specimen 2
High-definition image of sphalerite specimen with dark coloration and crystal structure.
High-definition image of sphalerite specimen with dark coloration and crystal structure.
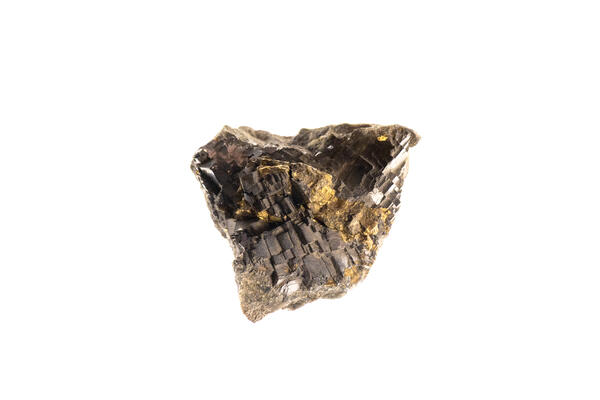
Sphalerite Specimen 4
USGS mineral specimen of sphalerite. High-definition image showing layered texture and metallic inclusions.
USGS mineral specimen of sphalerite. High-definition image showing layered texture and metallic inclusions.
Sphalerite Specimen 8
USGS mineral specimen of sphalerite. High-definition image showing crystal structure and dark coloration.
USGS mineral specimen of sphalerite. High-definition image showing crystal structure and dark coloration.
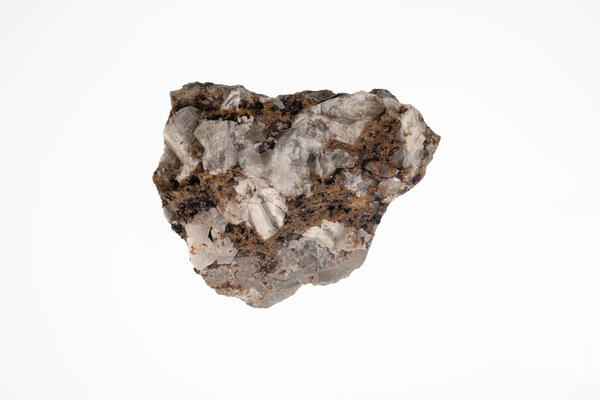
Sylvite, Halite & Polyhalite
Isolated specimen featuring sylvite, halite, and polyhalite. High-definition image showing crystal textures and varied coloration.
Isolated specimen featuring sylvite, halite, and polyhalite. High-definition image showing crystal textures and varied coloration.
Argentiferous Tetrahedrite 2
High-definition image of argentiferous tetrahedrite specimen with dark coloration and metallic inclusions.
High-definition image of argentiferous tetrahedrite specimen with dark coloration and metallic inclusions.
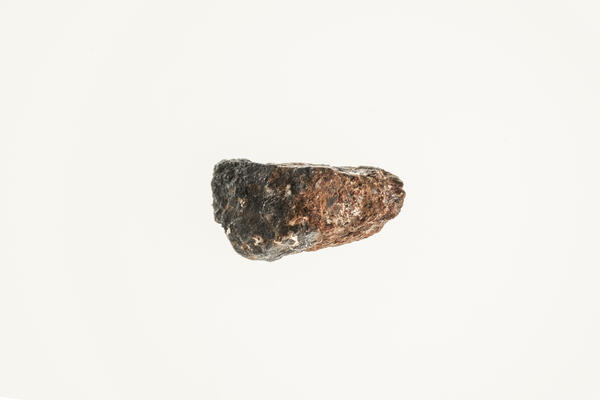
Wolframite (Tungsten Ore) 1
High-definition image of wolframite specimen with granular texture and black coloration.
High-definition image of wolframite specimen with granular texture and black coloration.
Zincite Specimen
High-definition image of zincite specimen with reddish-orange color and granular texture.
High-definition image of zincite specimen with reddish-orange color and granular texture.