



USGS scientists take streamflow and water quality measurements downstream of the Bonnet Carre Spillway near Norco, La. The Army Corps of Engineers uses USGS streamflow data to help them manage flood control structures.
View current flooding conditions
Access streamflow, precipitation, rate of change, NWS weather and flood stage, and more in the new National Water Dashboard
Access streamflow, precipitation, rate of change, NWS weather and flood stage, and more in the new National Water Dashboard
Flood Event Viewer
Access information and data associated with short-term, storm-event-based collection efforts
Access information and data associated with short-term, storm-event-based collection efforts
Visualize flooding
Interactive data visualizations for flooding related to hurricanes and flood events, quarterly streamflow summaries, and more
Interactive data visualizations for flooding related to hurricanes and flood events, quarterly streamflow summaries, and more
The USGS collects real-time flood data and conducts flood science to help keep communities safe before, during, and after a flood.
Floods can occur any time of year, and high-quality flood information is essential for flood forecasting and planning, emergency response, and recovery efforts. The USGS mission to protect life and property is a critical aspect of its role in the nation. By providing reliable scientific information about natural disasters, including flooding, the USGS can help minimize the risk, loss of life, and loss of property from floods. Key activities to this mission are to anticipate, monitor, and respond to hydrologic hazards by providing reliable water data and technical expertise to partner agencies and communities across the Nation. Our flood information provides real-time situational awareness, informs flood predictions, facilitates flood impact response and assessments, supports floodplain and flood inundation mapping, guides infrastructure design and operation, helps map contaminant transport, and more.
The USGS supports these activities through data collection, publication of flood-related publications, analysis of flood exceedance probabilities and magnitudes, and development of methods to estimate floods at unmonitored locations throughout the nation. The USGS develops and deploys observational systems for identifying and tracking flood hazards, providing operational support during extreme hydrologic events, providing data for recovery, and informing community planning and hazard mitigation strategies. These efforts include:
- Operating hydrologic networks , including providing real-time water levels and stream discharge, making field measurements to ensure the accuracy and completeness of our streamflow records, collecting annual peak discharge data, and installing rapid-deployment gages to temporarily expand our observational network during large flood events.
- Supporting flood forecasting by providing the National Weather Service with real-time water conditions, which they combine with their meteorological data to forecast flood magnitude and timing.
- Collecting ephemeral flood data, including deploying temporary water and meteorological data sensors ahead of large storms, computing peak flows, and collecting and surveying high-water marks to determine peak water levels after floodwaters recede. These types of field data are vital to emergency response and recovery, but most must be collected in person during or immediately after a storm when conditions may be dangerous. Our field personnel are dedicated to collecting and relaying flood data whenever safe conditions allow.
- Documenting and analyzing flood extents and impacts, including surveying of flooded areas, creating hydraulic models, and developing flood inundation maps
- Distributing timely and reliable flood-related information through online data portals and tools, programmatic web services, direct communication, internal and interagency flood operational calls, and support from USGS hydrologic science experts.
Media
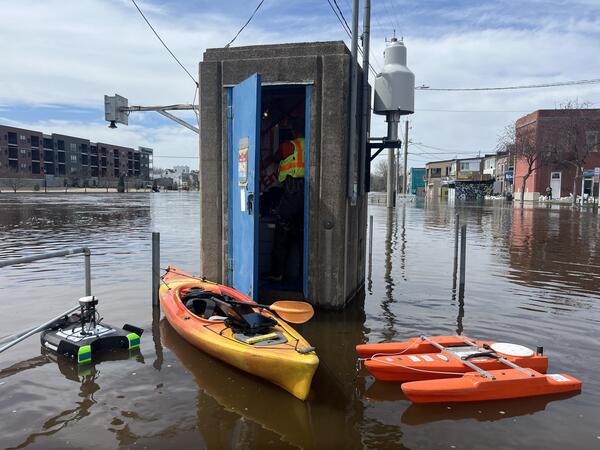
USGS hydrologic technicians service the flooded Wolf River at New London, Wisconsin streamgage, read sensors and compare data to outside reference points to verify accurate gage height data. A kayak and two acoustic Doppler current profilers (ADCPs) float outside of the gage. https://waterdata.usgs.gov/monitoring-location/USGS-04079000/
Sources/Usage: Public Domain. View Media Details
Media
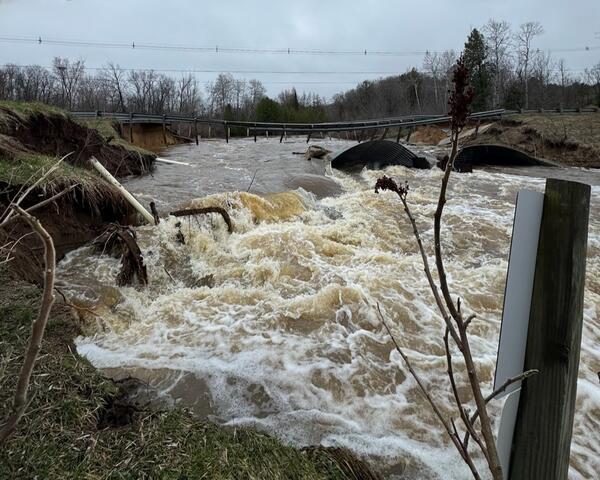
A bridge over the Boardman River near Traverse City, Michigan is washed out from raging flood waters. The white pipe on the left houses the data loggers for the streamgage at this site.Boardman River at Beitner RD NR Traverse City, MI - USGS Water Data for the Nation
Sources/Usage: Public Domain. View Media Details
During a flood, the USGS works directly with flood response agencies like the National Weather Service (NWS), Federal Emergency Management Agency (FEMA), U.S. Army Corps of Engineers (USACE), and state and local emergency management agencies to help them access and understand USGS flood data so they can make informed decisions and protect lives and property. USGS maintains two national response coordination teams -- the inland Flood Team and the Coastal Storm Team -- that liaise with our external partners and ensure a unified and effective response to major flood events. The response coordination teams supplement USGS operations and networks to acquire additional priority flood data to meet partner needs.
Learn more about how we study floods, how we measure and map flooding, and how we support flood event response by exploring the links listed on the Science tab.
Featured Flood Products
The USGS offers multiple products to help visualize current flood conditions, estimate flood quantiles, evaluate how large floods measure up historically, and access USGS flood response activities and data, including:
- Water Data for the Nation delivery tools
- National Water Dashboard: Access current flood and high-flow conditions, along with other streamflow information.
- WaterAlert: The WaterAlert service provides notifications to your email or phone for changes in water conditions based on thresholds you choose at USGS streamgages of interest to you.
- State Pages: Access current water conditions from all monitoring locations in a state that collect continuous data records
- Explore Water Data: A dynamic tool to filter and locate monitoring locations and water data that meet customizable use cases, such as flooding comparisons.
- Hydrologic Imagery Visualization and Information System (HIVIS): View still-frame images and timelapse videos from over 1,000 active webcams.
- Real-Time Flood Impact API: Displays locations where surveyed critical safety or infrastructure features near a USGS streamgage may be currently flooded.
- Flood Event Viewer: Explore streamflow, storm tide, wave height, high-water marks, and deployed sensor data for current and historical storm events.
- Flood Inundation Mapper: Explore sets of local inundation maps that show where flooding would occur – and how deep it might be - given a selected stream condition
- StreamStats web application and web page: Explore flood statistics at USGS streamgages, plot current conditions with respect to flood statistics, and provide estimates of flood quantiles at ungaged locations.




Sources/Usage: Public Domain. View Media Details
Below are other science projects associated with USGS flood information and activities.
Filter Total Items: 20

Water Data Visualizations
Water data visualizations are provocative visuals and captivating stories that inform, inspire, and empower people to address our Nation's most pressing water issues. USGS Vizlab is a group of data science and visualization experts who use visualizations to communicate water data in compelling and often interactive ways when static images or written narrative can’t effectively communicate the...
Flood Inundation Mapping (FIM) Program
The USGS Flood Inundation Mapping (FIM) Program helps communities protect lives and property by providing tools and information to help them understand their local flood risks and make cost-effective mitigation decisions.
High-Water Marks
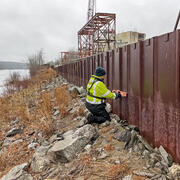
High-water marks are like footprints left behind by a flood — they show how high the water reached during a flood event. High-water marks serve as valuable data points for both educational purposes and scientific research, helping us understand past and recent flood events. Collecting this information is an essential and time-sensitive task for understanding flood risk and improving public safety.

Coastal Storm Modeling System (CoSMoS)
The Coastal Storm Modeling System (CoSMoS) makes detailed predictions of storm-induced coastal flooding, erosion, and cliff failures over large geographic scales. CoSMoS was developed for hindcast studies, operational applications and future climate scenarios to provide emergency responders and coastal planners with critical storm-hazards information that can be used to increase public safety...

Rapid Deployment Gages (RDGs)
Rapid Deployment Gages (RDGs) are fully-functional streamgages designed to be deployed quickly and temporarily to measure and transmit stream stage data in emergency situations.

StreamStats
StreamStats provides access to spatial analytical tools that are useful for water-resources planning and management, and for engineering and design purposes. The map-based user interface can be used to delineate drainage areas, get basin characteristics and estimates of flow statistics, and more. Available information varies from state to state.

Streamgaging Basics
Information on the flow of rivers and streams is a vital national asset that safeguards lives, protects property, and ensures adequate water supplies for the future. The USGS operates a network of more than 13,500 streamgages nationwide that provide streamflow information for a wide variety of uses including flood prediction, water management and allocation, engineering design, research, operation...

Surge, Wave, and Tide Hydrodynamics (SWaTH) Network
During large coastal storms, the storm surge and waves are the main cause of destruction and landscape change, transporting saline water, sediment, and debris inland. The USGS, in collaboration with stakeholders, has constructed a national Surge, Wave, and Tide Hydrodynamics (SWaTH) Network for the Atlantic, Eastern Pacific, and Central Pacific. SWaTH monitors and documents the height, extent, and...
Providing Major Storm and Short-Term Flood Event Data
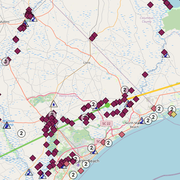
During major storms or other short-term events, the USGS collects streamflow and additional data to help document high-water events. This data is uploaded to the Short-Term Network (STN) for long-term archival and served out to the public through the Flood Event Viewer (FEV) which provides convenient, map-based access to downloadable event-based data.

Historical Flooding
The USGS provides practical, unbiased information about the Nation's rivers and streams that is crucial in mitigating hazards associated with floods. This site provides information about the USGS activities, data, and services provided during regional high-flow events, such as hurricanes or multi-state flooding events. The USGS response to these events is typically managed by the National Flood...

Hurricanes
Preventing flood hazards, such as hurricane-induced tidal surge, from becoming human disasters requires an understanding of the relative risks floods pose to specific communities and knowledge of the processes by which flood waters rise, converge, and abate. Historically, hurricane-induced tidal surge has been documented through measurement of high-water marks left on structures or vegetation...

Floods and Recurrence Intervals
A major storm or hurricane hits your area and on the radio you hear reference to a "100-year flood". But what exactly is a "100-year flood"? The term "100-year flood" is often used to describe a flood of great magnitude, but there is a lot more to it.
Filter Total Items: 51

USGS Measures Flooding Near Bonnet Carre Spillway
USGS scientists take streamflow and water quality measurements downstream of the Bonnet Carre Spillway near Norco, La. The Army Corps of Engineers uses USGS streamflow data to help them manage flood control structures.

Black River Flooding
USGS employee Tedd Wallace taking flow measurments with a teathered boat on the Black River at Black Rock, AR. Waters reached 16 feet above floodstage.
USGS employee Tedd Wallace taking flow measurments with a teathered boat on the Black River at Black Rock, AR. Waters reached 16 feet above floodstage.

Water Flowing Under the Bridge
James River above Arrowwood Lake near Kensal, North Dakota on April 13. James River had a streamflow of 6,550 cubic feet per second and stage of 13.84 feet.
James River above Arrowwood Lake near Kensal, North Dakota on April 13. James River had a streamflow of 6,550 cubic feet per second and stage of 13.84 feet.

Flooding of James River above Arrowwood Lake
James River above Arrowwood Lake near Kensal, North Dakota flooding on April 13. James River had a streamflow of 6,550 cubic feet per second and stage of 13.84 feet.
James River above Arrowwood Lake near Kensal, North Dakota flooding on April 13. James River had a streamflow of 6,550 cubic feet per second and stage of 13.84 feet.

Sorlie Bridge Flooded
Looking at the Sorlie Bridge at Grand Forks, ND from downstream.
Looking at the Sorlie Bridge at Grand Forks, ND from downstream.

Flowtracker measurement during flooding in Ithaca, NY
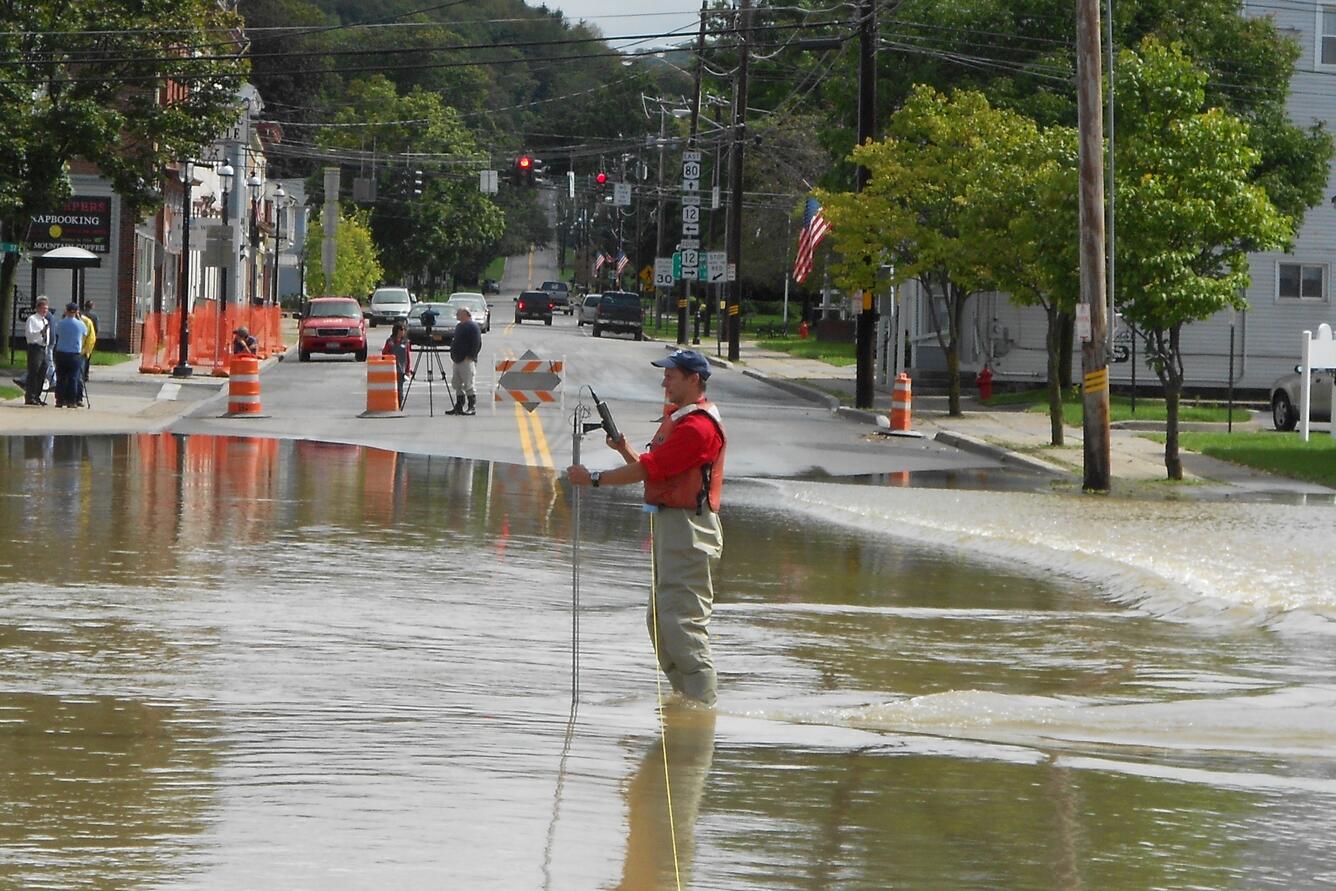
Flowtracker measurement during flooding in Ithaca, NYUSGS NYWSC staffer making flowtracker measurement ona flooded street in Ithaca, NY
Flowtracker measurement during flooding in Ithaca, NY
Flowtracker measurement during flooding in Ithaca, NYUSGS NYWSC staffer making flowtracker measurement ona flooded street in Ithaca, NY

Debris from Flooding
Debris from the Withlacoochee River near Lee, Florida, downstream from Pinetta, Florida, where the record gage height was recorded last week. (Monday, April 13, 2009)
Debris from the Withlacoochee River near Lee, Florida, downstream from Pinetta, Florida, where the record gage height was recorded last week. (Monday, April 13, 2009)

1997 Flooding in Grand Forks
Burned-out buildings in downtown Grand Forks, North Dakota.
Burned-out buildings in downtown Grand Forks, North Dakota.

Flooding in Grand Forks, North Dakota in 1997
Flood waters inundated Grand Forks, North Dakota and East Grand Forks, Minnesota.The picture is looking west to Grand Forks, North Dakota and the USGS gage house is the small white square in the center of the picture.
Flood waters inundated Grand Forks, North Dakota and East Grand Forks, Minnesota.The picture is looking west to Grand Forks, North Dakota and the USGS gage house is the small white square in the center of the picture.
The USGS collects real-time flood data and conducts flood science to help keep communities safe before, during, and after a flood.
Floods can occur any time of year, and high-quality flood information is essential for flood forecasting and planning, emergency response, and recovery efforts. The USGS mission to protect life and property is a critical aspect of its role in the nation. By providing reliable scientific information about natural disasters, including flooding, the USGS can help minimize the risk, loss of life, and loss of property from floods. Key activities to this mission are to anticipate, monitor, and respond to hydrologic hazards by providing reliable water data and technical expertise to partner agencies and communities across the Nation. Our flood information provides real-time situational awareness, informs flood predictions, facilitates flood impact response and assessments, supports floodplain and flood inundation mapping, guides infrastructure design and operation, helps map contaminant transport, and more.
The USGS supports these activities through data collection, publication of flood-related publications, analysis of flood exceedance probabilities and magnitudes, and development of methods to estimate floods at unmonitored locations throughout the nation. The USGS develops and deploys observational systems for identifying and tracking flood hazards, providing operational support during extreme hydrologic events, providing data for recovery, and informing community planning and hazard mitigation strategies. These efforts include:
- Operating hydrologic networks , including providing real-time water levels and stream discharge, making field measurements to ensure the accuracy and completeness of our streamflow records, collecting annual peak discharge data, and installing rapid-deployment gages to temporarily expand our observational network during large flood events.
- Supporting flood forecasting by providing the National Weather Service with real-time water conditions, which they combine with their meteorological data to forecast flood magnitude and timing.
- Collecting ephemeral flood data, including deploying temporary water and meteorological data sensors ahead of large storms, computing peak flows, and collecting and surveying high-water marks to determine peak water levels after floodwaters recede. These types of field data are vital to emergency response and recovery, but most must be collected in person during or immediately after a storm when conditions may be dangerous. Our field personnel are dedicated to collecting and relaying flood data whenever safe conditions allow.
- Documenting and analyzing flood extents and impacts, including surveying of flooded areas, creating hydraulic models, and developing flood inundation maps
- Distributing timely and reliable flood-related information through online data portals and tools, programmatic web services, direct communication, internal and interagency flood operational calls, and support from USGS hydrologic science experts.
Media
USGS hydrologic technicians service the flooded Wolf River at New London, Wisconsin streamgage, read sensors and compare data to outside reference points to verify accurate gage height data. A kayak and two acoustic Doppler current profilers (ADCPs) float outside of the gage. https://waterdata.usgs.gov/monitoring-location/USGS-04079000/
Sources/Usage: Public Domain. View Media Details
Media
A bridge over the Boardman River near Traverse City, Michigan is washed out from raging flood waters. The white pipe on the left houses the data loggers for the streamgage at this site.Boardman River at Beitner RD NR Traverse City, MI - USGS Water Data for the Nation
Sources/Usage: Public Domain. View Media Details
During a flood, the USGS works directly with flood response agencies like the National Weather Service (NWS), Federal Emergency Management Agency (FEMA), U.S. Army Corps of Engineers (USACE), and state and local emergency management agencies to help them access and understand USGS flood data so they can make informed decisions and protect lives and property. USGS maintains two national response coordination teams -- the inland Flood Team and the Coastal Storm Team -- that liaise with our external partners and ensure a unified and effective response to major flood events. The response coordination teams supplement USGS operations and networks to acquire additional priority flood data to meet partner needs.
Learn more about how we study floods, how we measure and map flooding, and how we support flood event response by exploring the links listed on the Science tab.
Featured Flood Products
The USGS offers multiple products to help visualize current flood conditions, estimate flood quantiles, evaluate how large floods measure up historically, and access USGS flood response activities and data, including:
- Water Data for the Nation delivery tools
- National Water Dashboard: Access current flood and high-flow conditions, along with other streamflow information.
- WaterAlert: The WaterAlert service provides notifications to your email or phone for changes in water conditions based on thresholds you choose at USGS streamgages of interest to you.
- State Pages: Access current water conditions from all monitoring locations in a state that collect continuous data records
- Explore Water Data: A dynamic tool to filter and locate monitoring locations and water data that meet customizable use cases, such as flooding comparisons.
- Hydrologic Imagery Visualization and Information System (HIVIS): View still-frame images and timelapse videos from over 1,000 active webcams.
- Real-Time Flood Impact API: Displays locations where surveyed critical safety or infrastructure features near a USGS streamgage may be currently flooded.
- Flood Event Viewer: Explore streamflow, storm tide, wave height, high-water marks, and deployed sensor data for current and historical storm events.
- Flood Inundation Mapper: Explore sets of local inundation maps that show where flooding would occur – and how deep it might be - given a selected stream condition
- StreamStats web application and web page: Explore flood statistics at USGS streamgages, plot current conditions with respect to flood statistics, and provide estimates of flood quantiles at ungaged locations.
Sources/Usage: Public Domain. View Media Details
Below are other science projects associated with USGS flood information and activities.
Filter Total Items: 20
Water Data Visualizations
Water data visualizations are provocative visuals and captivating stories that inform, inspire, and empower people to address our Nation's most pressing water issues. USGS Vizlab is a group of data science and visualization experts who use visualizations to communicate water data in compelling and often interactive ways when static images or written narrative can’t effectively communicate the...
Flood Inundation Mapping (FIM) Program
The USGS Flood Inundation Mapping (FIM) Program helps communities protect lives and property by providing tools and information to help them understand their local flood risks and make cost-effective mitigation decisions.
High-Water Marks
High-water marks are like footprints left behind by a flood — they show how high the water reached during a flood event. High-water marks serve as valuable data points for both educational purposes and scientific research, helping us understand past and recent flood events. Collecting this information is an essential and time-sensitive task for understanding flood risk and improving public safety.
Coastal Storm Modeling System (CoSMoS)
The Coastal Storm Modeling System (CoSMoS) makes detailed predictions of storm-induced coastal flooding, erosion, and cliff failures over large geographic scales. CoSMoS was developed for hindcast studies, operational applications and future climate scenarios to provide emergency responders and coastal planners with critical storm-hazards information that can be used to increase public safety...
Rapid Deployment Gages (RDGs)
Rapid Deployment Gages (RDGs) are fully-functional streamgages designed to be deployed quickly and temporarily to measure and transmit stream stage data in emergency situations.
StreamStats
StreamStats provides access to spatial analytical tools that are useful for water-resources planning and management, and for engineering and design purposes. The map-based user interface can be used to delineate drainage areas, get basin characteristics and estimates of flow statistics, and more. Available information varies from state to state.
Streamgaging Basics
Information on the flow of rivers and streams is a vital national asset that safeguards lives, protects property, and ensures adequate water supplies for the future. The USGS operates a network of more than 13,500 streamgages nationwide that provide streamflow information for a wide variety of uses including flood prediction, water management and allocation, engineering design, research, operation...
Surge, Wave, and Tide Hydrodynamics (SWaTH) Network
During large coastal storms, the storm surge and waves are the main cause of destruction and landscape change, transporting saline water, sediment, and debris inland. The USGS, in collaboration with stakeholders, has constructed a national Surge, Wave, and Tide Hydrodynamics (SWaTH) Network for the Atlantic, Eastern Pacific, and Central Pacific. SWaTH monitors and documents the height, extent, and...
Providing Major Storm and Short-Term Flood Event Data
During major storms or other short-term events, the USGS collects streamflow and additional data to help document high-water events. This data is uploaded to the Short-Term Network (STN) for long-term archival and served out to the public through the Flood Event Viewer (FEV) which provides convenient, map-based access to downloadable event-based data.
Historical Flooding
The USGS provides practical, unbiased information about the Nation's rivers and streams that is crucial in mitigating hazards associated with floods. This site provides information about the USGS activities, data, and services provided during regional high-flow events, such as hurricanes or multi-state flooding events. The USGS response to these events is typically managed by the National Flood...
Hurricanes
Preventing flood hazards, such as hurricane-induced tidal surge, from becoming human disasters requires an understanding of the relative risks floods pose to specific communities and knowledge of the processes by which flood waters rise, converge, and abate. Historically, hurricane-induced tidal surge has been documented through measurement of high-water marks left on structures or vegetation...
Floods and Recurrence Intervals
A major storm or hurricane hits your area and on the radio you hear reference to a "100-year flood". But what exactly is a "100-year flood"? The term "100-year flood" is often used to describe a flood of great magnitude, but there is a lot more to it.
Filter Total Items: 51
USGS Measures Flooding Near Bonnet Carre Spillway
USGS scientists take streamflow and water quality measurements downstream of the Bonnet Carre Spillway near Norco, La. The Army Corps of Engineers uses USGS streamflow data to help them manage flood control structures.
USGS scientists take streamflow and water quality measurements downstream of the Bonnet Carre Spillway near Norco, La. The Army Corps of Engineers uses USGS streamflow data to help them manage flood control structures.
Black River Flooding
USGS employee Tedd Wallace taking flow measurments with a teathered boat on the Black River at Black Rock, AR. Waters reached 16 feet above floodstage.
USGS employee Tedd Wallace taking flow measurments with a teathered boat on the Black River at Black Rock, AR. Waters reached 16 feet above floodstage.
Water Flowing Under the Bridge
James River above Arrowwood Lake near Kensal, North Dakota on April 13. James River had a streamflow of 6,550 cubic feet per second and stage of 13.84 feet.
James River above Arrowwood Lake near Kensal, North Dakota on April 13. James River had a streamflow of 6,550 cubic feet per second and stage of 13.84 feet.
Flooding of James River above Arrowwood Lake
James River above Arrowwood Lake near Kensal, North Dakota flooding on April 13. James River had a streamflow of 6,550 cubic feet per second and stage of 13.84 feet.
James River above Arrowwood Lake near Kensal, North Dakota flooding on April 13. James River had a streamflow of 6,550 cubic feet per second and stage of 13.84 feet.
Sorlie Bridge Flooded
Looking at the Sorlie Bridge at Grand Forks, ND from downstream.
Looking at the Sorlie Bridge at Grand Forks, ND from downstream.
Flowtracker measurement during flooding in Ithaca, NY
Flowtracker measurement during flooding in Ithaca, NYUSGS NYWSC staffer making flowtracker measurement ona flooded street in Ithaca, NY
Flowtracker measurement during flooding in Ithaca, NY
Flowtracker measurement during flooding in Ithaca, NYUSGS NYWSC staffer making flowtracker measurement ona flooded street in Ithaca, NY
Debris from Flooding
Debris from the Withlacoochee River near Lee, Florida, downstream from Pinetta, Florida, where the record gage height was recorded last week. (Monday, April 13, 2009)
Debris from the Withlacoochee River near Lee, Florida, downstream from Pinetta, Florida, where the record gage height was recorded last week. (Monday, April 13, 2009)
1997 Flooding in Grand Forks
Burned-out buildings in downtown Grand Forks, North Dakota.
Burned-out buildings in downtown Grand Forks, North Dakota.
Flooding in Grand Forks, North Dakota in 1997
Flood waters inundated Grand Forks, North Dakota and East Grand Forks, Minnesota.The picture is looking west to Grand Forks, North Dakota and the USGS gage house is the small white square in the center of the picture.
Flood waters inundated Grand Forks, North Dakota and East Grand Forks, Minnesota.The picture is looking west to Grand Forks, North Dakota and the USGS gage house is the small white square in the center of the picture.