
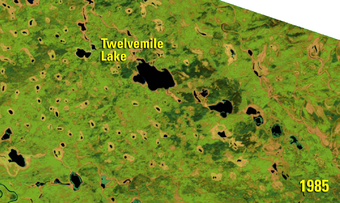
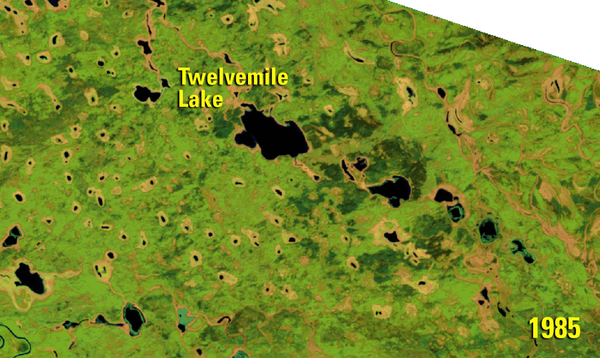
Animation of Twelvemile Lake in the Yukon Flats ecoregion in Alaska, created using USGS Landsat data.
Landsat, Permafrost Data Offer Insight into Arctic Lake Dynamics
By Earth Resources Observation and Science (EROS) Center
March 27, 2019
Lakes don’t always behave as they’re expected to. Especially lakes in remote Arctic locales like Alaska’s Yukon Flats, where permafrost plays heavily into their behavior.
Media
Sources/Usage: Public Domain. View Media Details
Lakes atop solid permafrost tend to grow or shrink based on observable, aboveground factors — think precipitation, evaporation or snowmelt runoff — because the thick frozen soil beneath them prevents movement into the subsurface.
Lakes atop patchy permafrost see more erratic change, sometimes shrinking or growing as water flows in or out through gravelly channels invisible to the naked eye. As the pace of permafrost thaw has quickened with a warming climate, many of those lakes have shrunk. Some have disappeared altogether.
It would be tempting to conclude that permafrost thaw will lead to the mass disappearance of lakes. But remarkably little is known about the subsurface connections between the thousands of lakes scattered across ecoregions like Yukon Flats, where solid and patchy permafrost intermingle across the region.
Lakes are dynamic by nature, and remote sensing surveys are replete with case studies in unpredictability.
“We see things happen in the data that don’t add up,” said Jennifer Rover, a research scientist at the USGS Earth Resources Observation and Science (EROS) Center who began using Landsat satellite data to build time-series maps of the Yukon Flats nearly a decade ago. “As soon as you add more observations, you find out that what you thought you understood? No, it doesn’t have the same pattern.”
Take Twelvemile Lake, for example. It sits 19 miles southwest of a tiny rural outpost named Fort Yukon, insulated from the influence of urban growth, industry or agriculture. It lost 60 percent of its surface area between 1979 and 2009, suggesting permafrost melt and underground drainage.
But the story of Twelvemile wasn’t so simple. Another lake just over a mile away — a lake subject to the same climactic forces as its larger neighbor — scarcely shifted in size during those three decades. What’s more, flooding refilled Twelvemile shortly after its staggering losses. As of 2018, it’s as full as it’s been since the 1970s.
Scale up the story of a single isolated lake to a story of thousands, and the notion of a wide-scale and cohesive understanding of lake dynamics in Arctic ecoregions - where the world’s largest concentration of lakes are found - becomes disarmingly difficult to envision.
Difficult, perhaps, but not impossible.
A recent collaboration between the Colorado School of Mines, EROS, and USGS in Denver took a novel approach to the question of lake dynamics in a 35,000-square-kilometer stretch of the Yukon Flats ecoregion. The study, published in Environmental Research Letters, combined 30 years of Landsat data on lake surface area was combined with Airborne Electromagnetic (AEM) surveys of permafrost distribution.
Integrating the two datasets allowed the researchers to cluster thousands of lakes into groups and look for patterns that might explain how and why water was moving.
The results suggested that lakes in areas of discontinuous permafrost – coverage of 50 to 90 percent – saw more change driven by flooding or lateral movement just beneath the surface. Continuous permafrost – coverage of 90 percent or more – isolated lakes from subsurface factors.
“For us, we found that areas with more continuous permafrost had more synchronous lake dynamics,” said David Rey, the study’s lead author. “The less continuous the permafrost, the more different processes were involved in controlling these lakes.”
As solid permafrost thaws, the study suggests, lakes with previously “synchronous” dynamics may be subject to more of those influences and lose that synchronicity, altering patterns of change across Arctic watersheds.
More importantly, perhaps, the study’s approach offers a guidepost for future research in the Arctic’s rapidly-changing boreal regions.
Study builds on prior research
The new paper builds a 2013 study from some of the same co-authors – including Rover and USGS scientists in Denver – that used data integration on a smaller scale.
The previous work looked at 5,150 square kilometers in the Yukon Flats, using Landsat data from 1979-2009 and a single AEM survey from 2010. The hypothesis was that changes to lakes captured by satellite data might be explained by the presence of open taliks – unfrozen vertical pathways – beneath them.
“Really, the takeaway (from the 2013 study) was that there doesn’t seem to be any statistical information to support that, so maybe a lot of this was going on in the shallow subsurface,” Rey said.
Another AEM survey was performed on the western side of the Flats in 2016, where permafrost is thicker and more continuous. Adding both surveys to a Landsat time series over a larger area offered a unique opportunity.
“What a lot of people will do is look at different regions - an ice rich area versus an ice poor area. We can look at this area that’s more thawed to get a glimpse into what this more frozen area might look like as it thaws,” Rey said. “That was the nice thing about Yukon Flats. We had these two (AEM) surveys, and they had such different permafrost conditions that we were able to play that game in the same region.”
The initial dataset included more than 6,800 lakes, a number pared down by removing lakes with insufficient observations. Of the 4,230 that remained, 2,200 were placed into fourteen clusters and sorted into five distinct groups based on permafrost extent, proximity to rivers and streams, and permanence.
Among the findings:
- 66 percent of lakes were connected to other lakes, rivers or streams at some point during the year,
- 19 percent also had shallow subsurface connections with other water bodies,
- 15 percent were isolated by permafrost
Two of the five lake groups were classified as “flashy,” a reference to erratic ups and downs in lake area over time. For lakes near rivers and streams, the team learned, flashiness was closely connected to flooding caused by ice jams.
Media

Sources/Usage: Public Domain. View Media Details
“Flooding is a really important process, Rey said. “Yukon Flats are really low in topographic relief. So if a river tops its banks, it doesn’t take that much river rise to propagate water pretty far.”
Lakes further from rivers and streams were less affected by floods. They might also see the greatest impact from permafrost thaw. The data showed that such lakes in areas of discontinuous permafrost had the greatest loss of surface area.
The researchers extrapolated that if lakes in continuous permafrost areas begin to drain in the future due to permafrost thaw and are not in areas recharged by floods, they could see a large loss in surface area.
However, Rey said, “we currently have a poor understanding of how climate change will influence ice jam flooding frequency and magnitude.”
Long-term permafrost change could bring the dynamics of those lakes into alignment, however. Shallow gravel pathways for water transfer are unevenly distributed now, but such pathways would open with continued thaw.
“If a lake’s not isolated by ice and water can be transmitted between lakes through these really porous subsurface materials, the changes in those lakes should be similar,” Rey said.
Work offers path forward in study of Arctic lakes
The new paper offers the widest application yet of integrated permafrost extent and surface water data, but the groundwork for that integration was laid by years of remote sensing research.
Rover’s initial inquiries into Arctic lake dynamics were undertaken to add context to studies in the mid-2000s that used satellite data to highlight what appeared to be severe lake losses.
One looked at nearly 11,000 Siberian lakes and found that 11 percent of them had disappeared amid increases in precipitation, suggesting permafrost thaw as the main driver of change. Another compared closed-basin ponds in Alaska’s Arctic Coastal Plain to those in forested regions far to the south. Once again, the study suggested severe lake area loss – as high as 54 percent - amid permafrost thaw.
Both studies, however, leaned heavily on snapshots in time. The first compared data from the 1970s with data from 1997 and 2004. The second used aerial imagery from the 1950s and 2002, as well as Landsat images from 1999-2002 and 1991-1995.
Media

Sources/Usage: Public Domain. View Media Details
By contrast, Rover and her EROS colleagues built the first time series of lake area by using every clear observation between 1979 and 2009 over a single Landsat path/row in the Yukon Flats.
“Since lakes tend to be very dynamic in nature, I thought that statistically, you can’t really conclude anything from a few measurements,” Rover said. “I wondered, if we actually look at a significant number of measurements through time, what’s actually changing on the ground?”
Arctic lake change was indeed more complex than those earlier snapshots suggested. The deeper timeseries added a layer of complexity and context to the emergent issue of surface water change in the rapidly-warming Arctic. The resulting 2012 paper pointed to less dramatic lake losses, closer to 3.4 percent.
“Obviously, I don't conclude in my work that there are not changes, just that changes need to be put into perspective with more observations—and this is something we can do with remote sensing,” Rover said. “The more information we have prior to making conclusions or management decisions, the better.”
That initial work caught the attention of the U.S. Fish and Wildlife Service. The FWS asked Rover to extend the dataset through the entire Yukon Flats National Wildlife Refuge.
Each successive project built upon the 2012 work, framed as a dataset that would provide “an opportunity for additional research assessing the drivers of lake and wetland change in this region.” It has since served as the basis for studies on the impact of lake change on migratory birds and isotope-based water balance, as well as the earlier AEM study.
“The success of that project was part of the reason the new AEM data were collected, and they knew I had more lake data,” Rover said.
Notably, the creation of similar datasets has gotten much easier. Recently, Landsat Level-3 Science Products were added to the public data archive. One of them, Dynamic Surface Water Extent (DSWE), allows users to download decades of pre-processed Landsat scenes that identify surface water, removing several of the steps required to produce the original Yukon Flats data.
“That saves someone the time of having to create their own maps, Rover said. “Making water maps is actually pretty easy to do now. It wasn’t when we were doing this.”
Rover and Rey both pointed to combining time series data with other data types as important next steps toward furthering the understanding of a changing Arctic. Integrating permafrost distribution, lake area and water chemistry could offer greater insight into the drivers of change.
Each step offers guidance in answering the big unanswered questions posed by change in the Arctic.
“As this environment warms and we have more discontinuous permafrost, what does that mean for our land surface? For our water?” Rover said. “We expect to see some changes, but we don’t know exactly what that means or where.”
Related

Inland Lakes, Rivers and Streams
Water bodies surrounded by land serve as sources of fresh drinking water, play host to millions of species of fish, underwater vegetation and wildlife and maintain the vibrancy of surrounding ecosystems. These water bodies can also be hubs for recreational activities such as boating, fishing, waterskiing, swimming that boost local economies.
Twelvemile Lake - Change Over Time
Animation of Twelvemile Lake in the Yukon Flats ecoregion in Alaska, created using USGS Landsat data.
Related
Inland Lakes, Rivers and Streams
Water bodies surrounded by land serve as sources of fresh drinking water, play host to millions of species of fish, underwater vegetation and wildlife and maintain the vibrancy of surrounding ecosystems. These water bodies can also be hubs for recreational activities such as boating, fishing, waterskiing, swimming that boost local economies.
Twelvemile Lake - Change Over Time
Animation of Twelvemile Lake in the Yukon Flats ecoregion in Alaska, created using USGS Landsat data.
Animation of Twelvemile Lake in the Yukon Flats ecoregion in Alaska, created using USGS Landsat data.