
New England WSC Hydrologic Monitoring Program Summer 2021 Update
Streamflow conditions in New England were variable from North to South during the period of mid-June to late August and leading up to this period, drought conditions appeared imminent. However, most of central and southern New England received above normal precipitation, which lead to above normal streamflow conditions.
In contrast, northern New England and eastern Cape Cod remained in abnormally dry and drought conditions through August. The map of New England below displays the average streamflow for the month of July 2021 and highlights the variable conditions for New England.

Precipitation is the driving force behind this summer’s streamflow conditions in New England, and the graphic below highlights precipitation departure from normal for the past 90 days (through Aug. 31, 2021). As one would expect, northern New England and eastern Cape Cod are below normal, and the rest of New England is above normal.

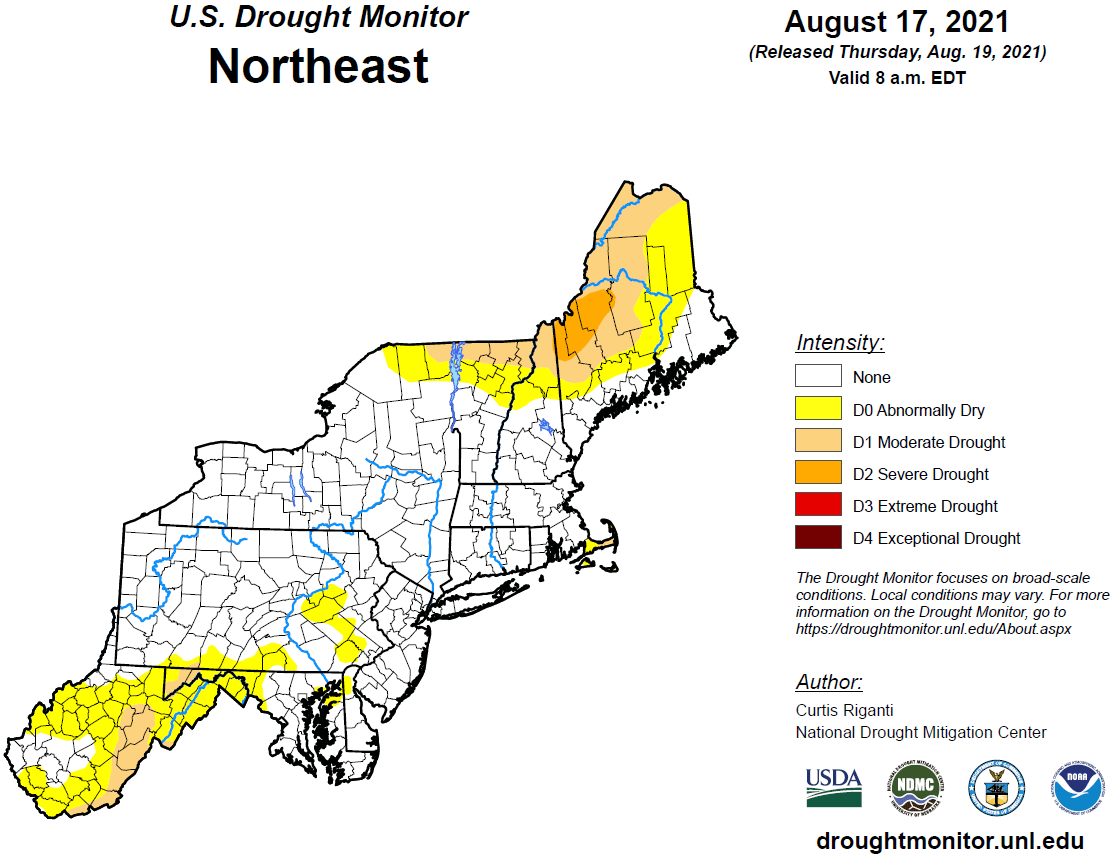
Drought conditions are assessed and mapped by the U.S. Drought Monitor. The map below of the Northeast Region shows the status of dry and drought conditions as they were on August 17, 2021.
Note
The USGS Water Data for the Nation web presence is launching the Next Generation Monitoring Location pages! Explore an example of a New England WSC monitoring location by visiting the Next Generation page for St. John River at Ninemile Bridge, Maine. Each Next Generation page will have a link to the classic page, and the classic pages in turn have links to the replacement pages. All classic pages will automatically redirect to the Next Generation pages beginning in March 2022.