An official website of the United States government
Here's how you know
Official websites use .gov
A .gov website belongs to an official government organization in the United States.
Secure .gov websites use HTTPS
A lock () or https:// means you’ve safely connected to the .gov website. Share sensitive information only on official, secure websites.
Predicted probabilities of dune erosion (inner strip), overwash (middle strip), and inundation (outer strip) for Hurricane Harvey. Pictures are representative of coastal change observed during past storm events.(Public domain.)
The coastal change forecast model predicts the probability of where and how primary sand dunes along the coast will be impacted by water levels during a storm. This includes the combined effect of surge and wave runup. The color band closest to the shoreline is the probability of dune erosion, the middle color band is the probability that sand dunes will be overtopped by waves during the storm and the outer color band is the probability that the sand dunes will be completely inundated/flooded. The model forecast is available on the coastal change hazards portal and more information about the model.
Below is an initial comparison of imagery collected by the National Oceanic and Atmospheric Administration (NOAA) in 2015 with similar imagery taken a few days after Hurricane Harvey's landfall (https://storms.ngs.noaa.gov/). These photos provide information about how the coastal was impacted by the storm and can be used as validation for the model.
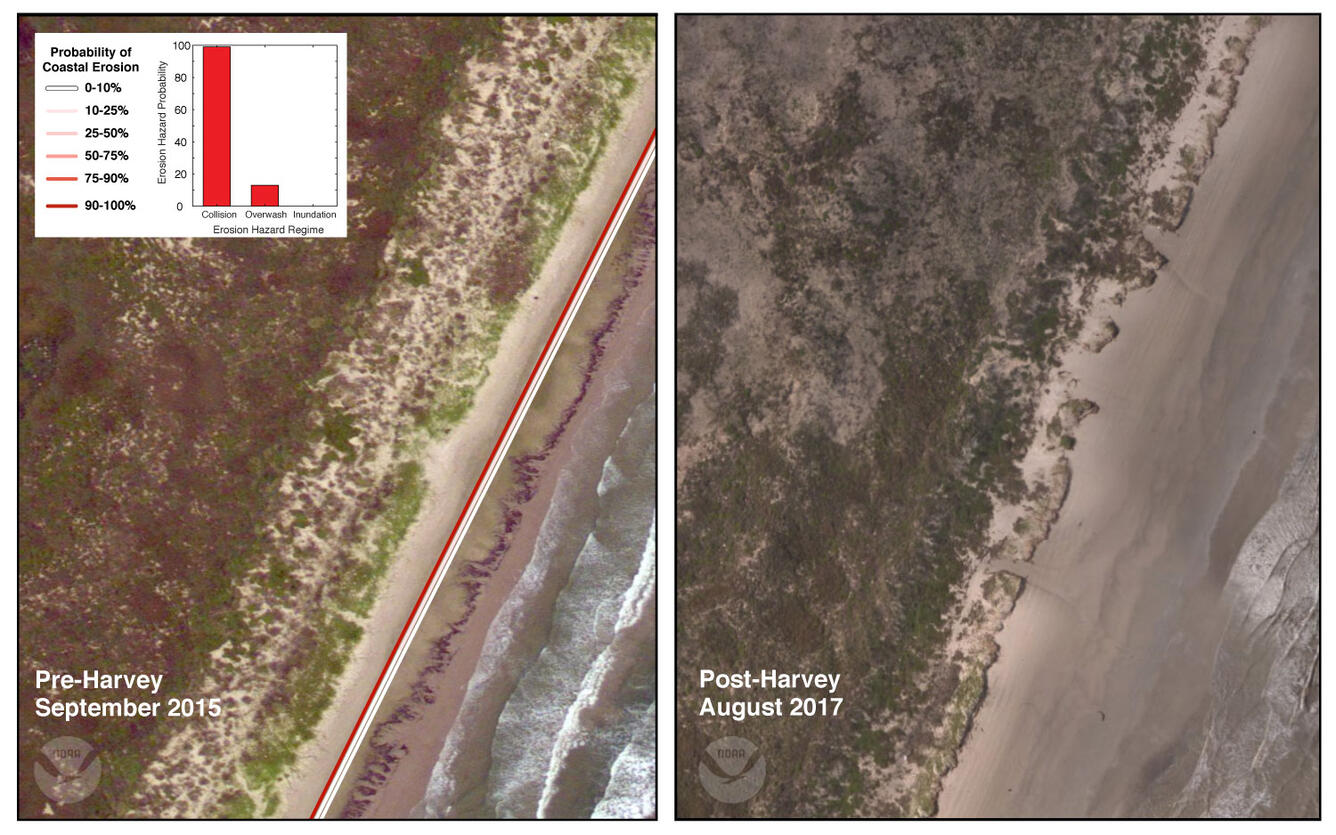
Elevated water levels during Hurricane Harvey reached the base but did not overtop the ~5m high dunes in Mustang Island, Texas, leading to dune erosion. The predicted probability of dune erosion for this section of coast was 99%.(Public domain.)
Multiple breaches were cut through the south end of San Jose Island, Texas, just north of Aransas Pass. The predicted probability of inundation was low, only 21%, however the probability of overwash was 87%. When water levels are elevated through several tidal cycles, as was likely the case during Hurricane Harvey, the dunes can continue to erode through time and may even erode completely.(Public domain.)
At the north end of Matagorda Island, Texas, storm waves and surge inundated a low-lying section of the coastline causing a 340-meter wide breach. The predicted probability of inundation here was 90%(Public domain.)
Sand dunes along this stretch of coast in Sargent, Texas, were overwashed by large waves during the storm. Sand from the beach and dunes is covering the roadway behind the dunes and which may be impassable. The predicted probability of overwash in this area was 94%.(Public domain.)
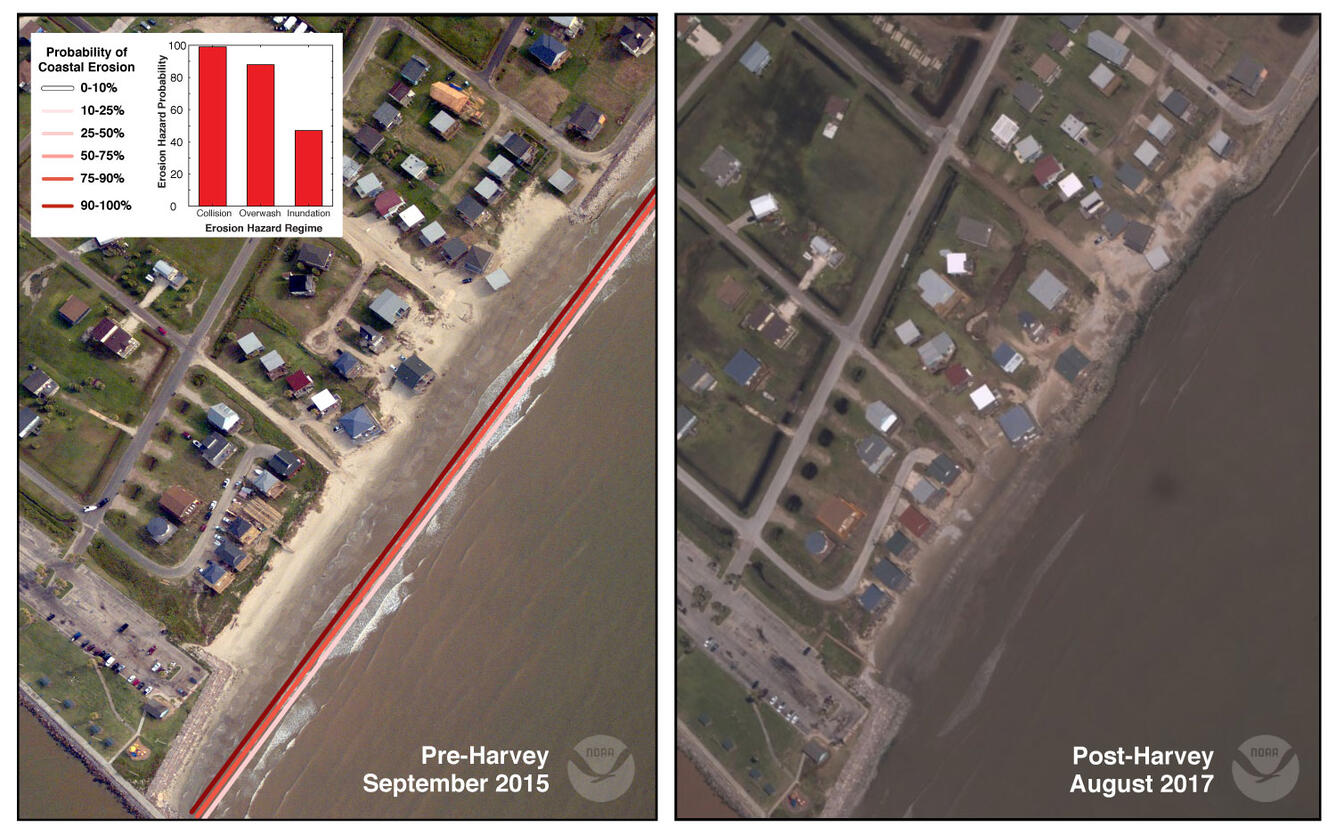
Erosion of the beach in front of this developed area in Surfside, Texas, occurred as a result of elevated water levels during the storm. The vegetated dune at the bottom of the image was overwashed with sand being moved between and behind the oceanfront homes. The predicted probability of overwash here was 88%.(Public domain.)
Interactive access to coastal change science and data for our Nation’s coasts. Information and products are organized within three coastal change hazard themes: 1) extreme storms, 2) shoreline change, and 3) sea-level rise. Displays probabilities of coastal erosion.
Interactive access to coastal change science and data for our Nation’s coasts. Information and products are organized within three coastal change hazard themes: 1) extreme storms, 2) shoreline change, and 3) sea-level rise. Displays probabilities of coastal erosion.