
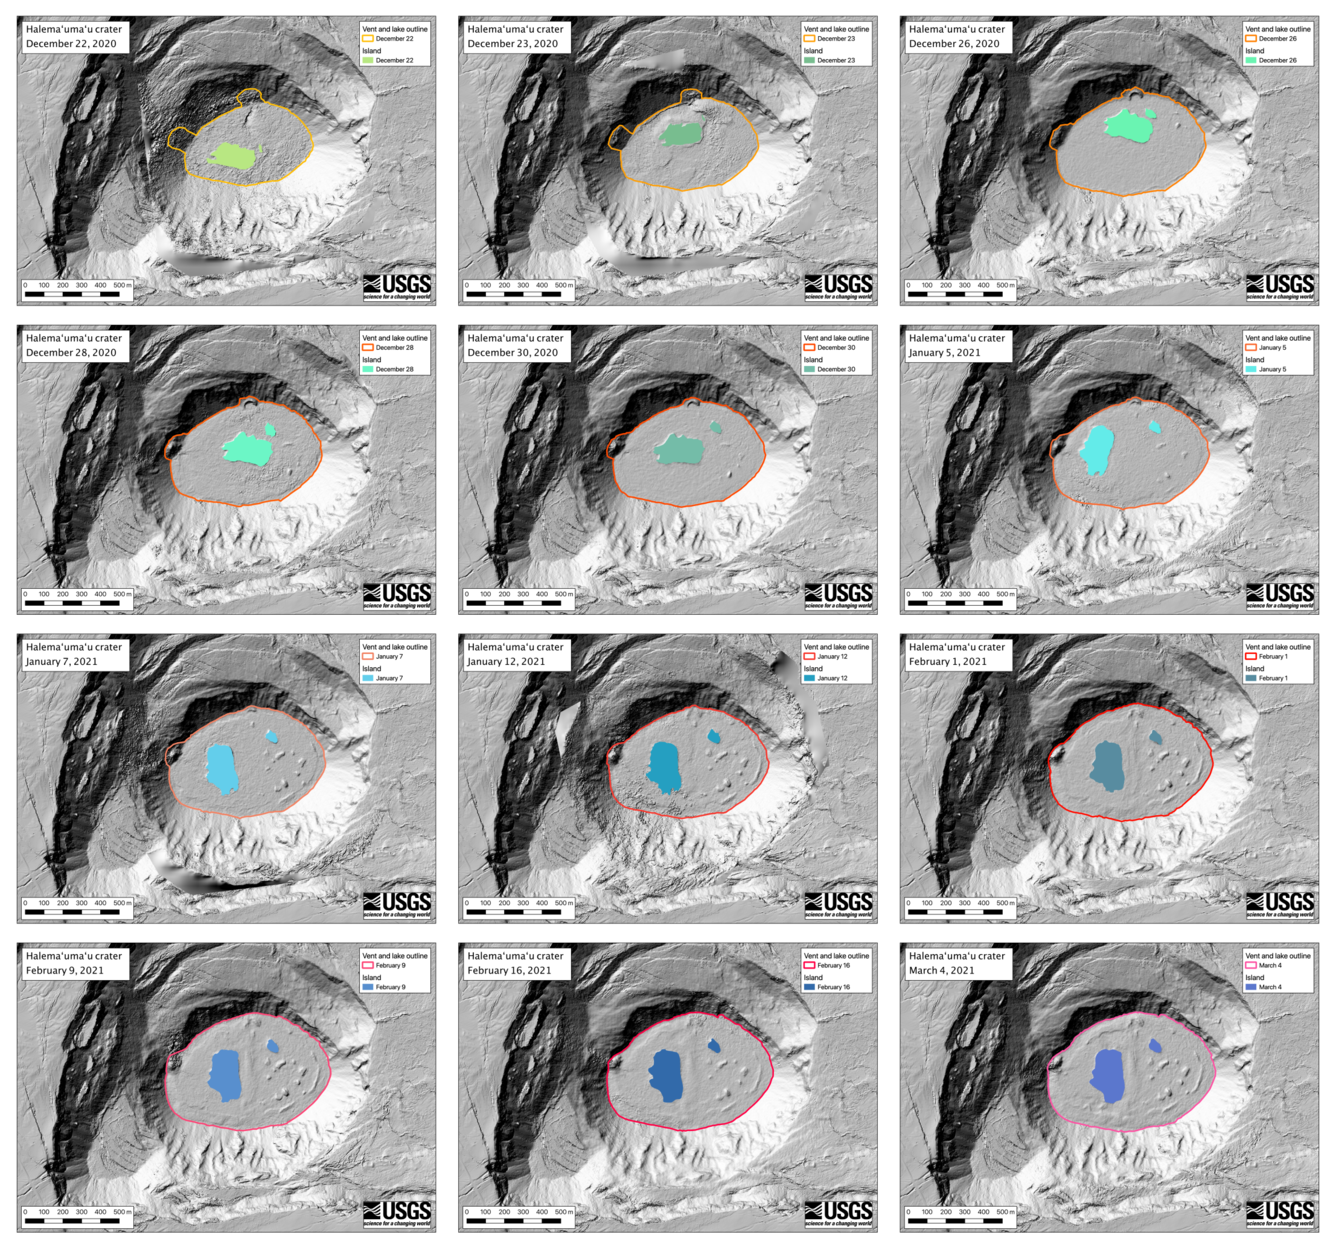
Halema‘uma‘u eruption sequence Digital Elevation Models
March 8, 2021
Media
Sources/Usage: Public Domain. View Media Details