
A quiet exhalation at Long Valley
Last week we talked about how Long Valley has been seismically quiet during the past few years. Alongside this seismic quiescence, Long Valley has also been deflating.
The California Volcano Monitor is a weekly column written by scientists and collaborators of the California Volcano Observatory. This week's contribution is from Josh Crozier and Alicia Hotovec-Ellis, geophysicists with the U.S. Geological Survey.
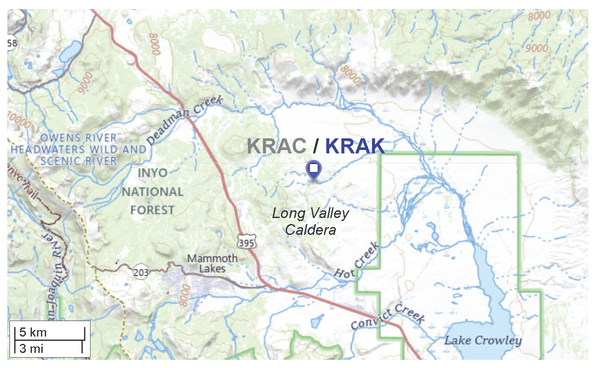
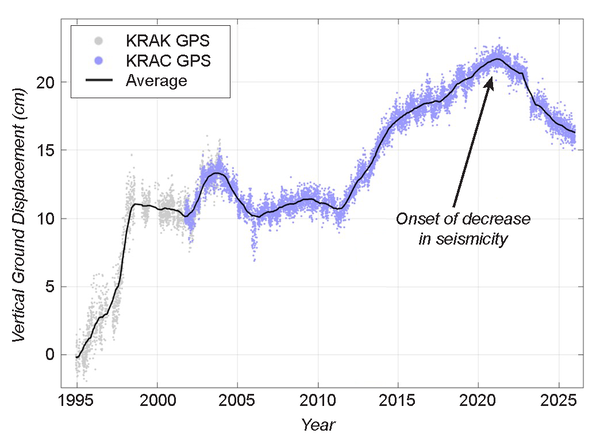
GPS stations used by the USGS (1st image) show that the central part of the caldera has subsided by about 2.4 in (6 cm) since 2021 (2nd image). This might not seem like a lot, but it has been the most significant subsidence at Long Valley since detailed measurements began in the 1980s. It’s dramatic – but is it concerning?
Not when you look at the big picture. Calderas like Long Valley “breathe” over time. The ground will alternately inflate (inhale) then deflate (exhale), without any accompanying eruption. Ground deformation episodes are how the surface of the earth reflects changes in underground magmatic or hydrothermal systems, and can last for many years. Inflation attracts more attention than deflation, but both stages provide important information about the inner workings of a volcano.
We can compare the current deflation to several inflation episodes that happened between 1980 and 2021. The ground has moved in nearly opposite directions during those inflations, which suggests that the current deflation shares a similar source location under the caldera’s resurgent dome. However, the previous decades of inflation accumulated nearly 3 ft (a meter) of uplift. This means that the deflation so far has reversed only a small fraction of the previous inflation. Right now there's no way to predict whether the ground subsidence will continue for months or for decades or more. For now, visitors and residents can appreciate witnessing a gentle “volcanic exhalation.”