
Mapping snow- and ice-free zones to monitor thermal activity in Yellowstone using high-resolution commercial satellite imagery
Yellowstone’s thermal areas can have subtle regions of heated ground. High-resolution commercial satellite images provide a new way of accurately mapping these details.
Yellowstone Caldera Chronicles is a weekly column written by scientists and collaborators of the Yellowstone Volcano Observatory. This week's contribution is from Connor Phillips, student contractor with the U.S. Geological Survey.
With over a hundred distinct thermal areas containing over 10,000 discrete thermal features, Yellowstone National Park’s geothermal landscape is incredibly vast and constantly changing. While many thermal areas are popular destinations accessible via park roads and trails, others are located in the backcountry and difficult to access. Satellite imagery is thus vital for monitoring Yellowstone thermal activity and can detect changes we wouldn’t otherwise know about.
Satellites with thermal infrared instruments, like ASTER and Landsat 8/9, are exceptional tools for measuring heat output from thermal areas in Yellowstone. With football-field-sized pixels, however, these data cannot detect small thermal areas or temperature changes that are too subtle. Through a grant from NASA’s Commercial SmallSat Data Scientific Analysis Program, Yellowstone Volcano Observatory (YVO) scientists have been able to analyze high-resolution satellite data repositories from Vantor (formerly Maxar) going back to 2002. Vantor’s satellites include WorldView-1, -2, -3, GeoEye-1, and QuickBird-2, which can detect features as small as a meter (about 3 feet). By analyzing these data, it is possible to detect small areas that may show evidence of surface thermal activity, such as vegetation stress, mineral deposits, and water discoloration or changing water levels, and also how activity changes from year to year.
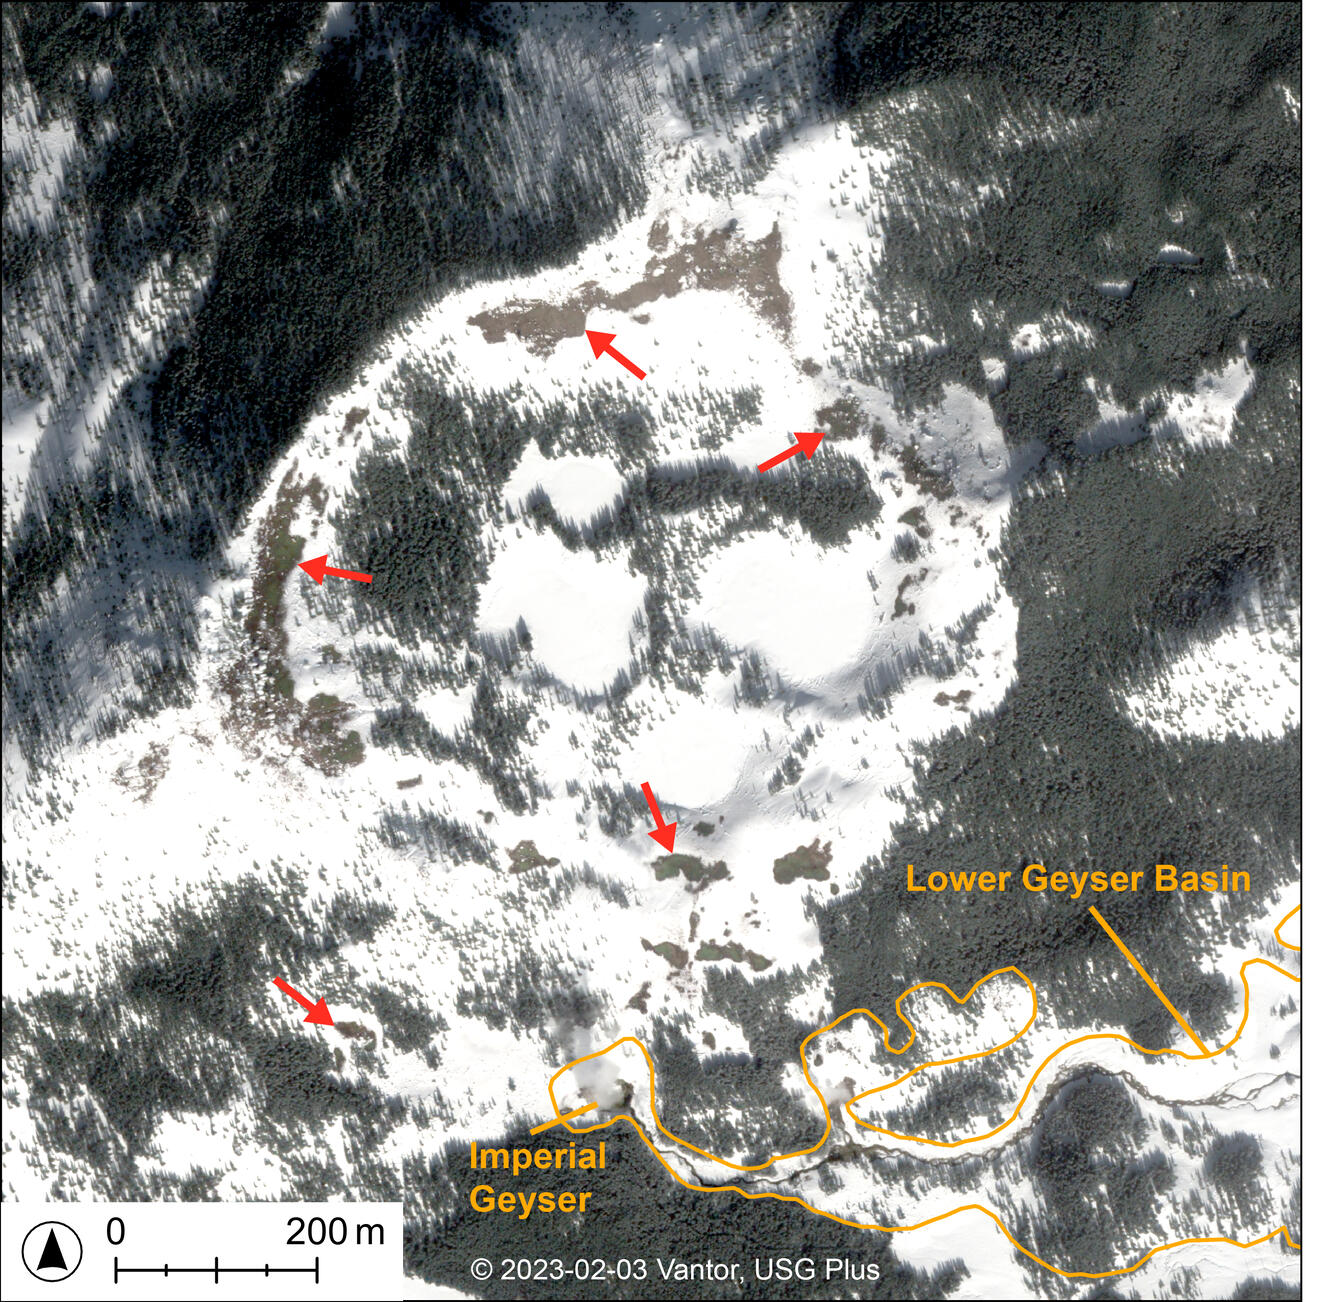
Image data acquired during winter months in Yellowstone (a time when it would be especially challenging or even dangerous for field surveys) have become a crucial resource for tracking visible signs of surface thermal activity. Due to Yellowstone’s elevation and climate, massive snowstorms frequently visit the park in the winter. And with persistent freezing temperatures, the snowpack generally clings to the ground until late spring. Snowy wintertime images are extremely useful for detecting areas of bare ground and thawed liquid on otherwise icy water bodies that are suggestive of thermal activity. Think of the snow and ice as a layer that helps differentiate warmer ground from the surrounding cooler ground.
The amount of snow and ice covering the landscape can vary from month-to-month, year-to-year, and image-to-image. Thus, it is also important to incorporate weather station data into mapping of snow- and ice-free zones to gain a better picture of the surface conditions in a given wintertime satellite image. Seven different weather stations cover the extent of Yellowstone, and data from the station that is closest to an area of interest provides a sense of the snow depth, average daily temperature, and time since last snowfall. For instance, when the snow depth is over 1 meter (about 40 inches) and the temperature hasn’t risen above about -7 °C (20 °F) in several days, the conditions are ideal for identifying zones within thermal areas that are producing the most surface heat.
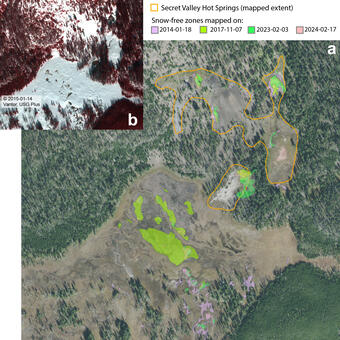
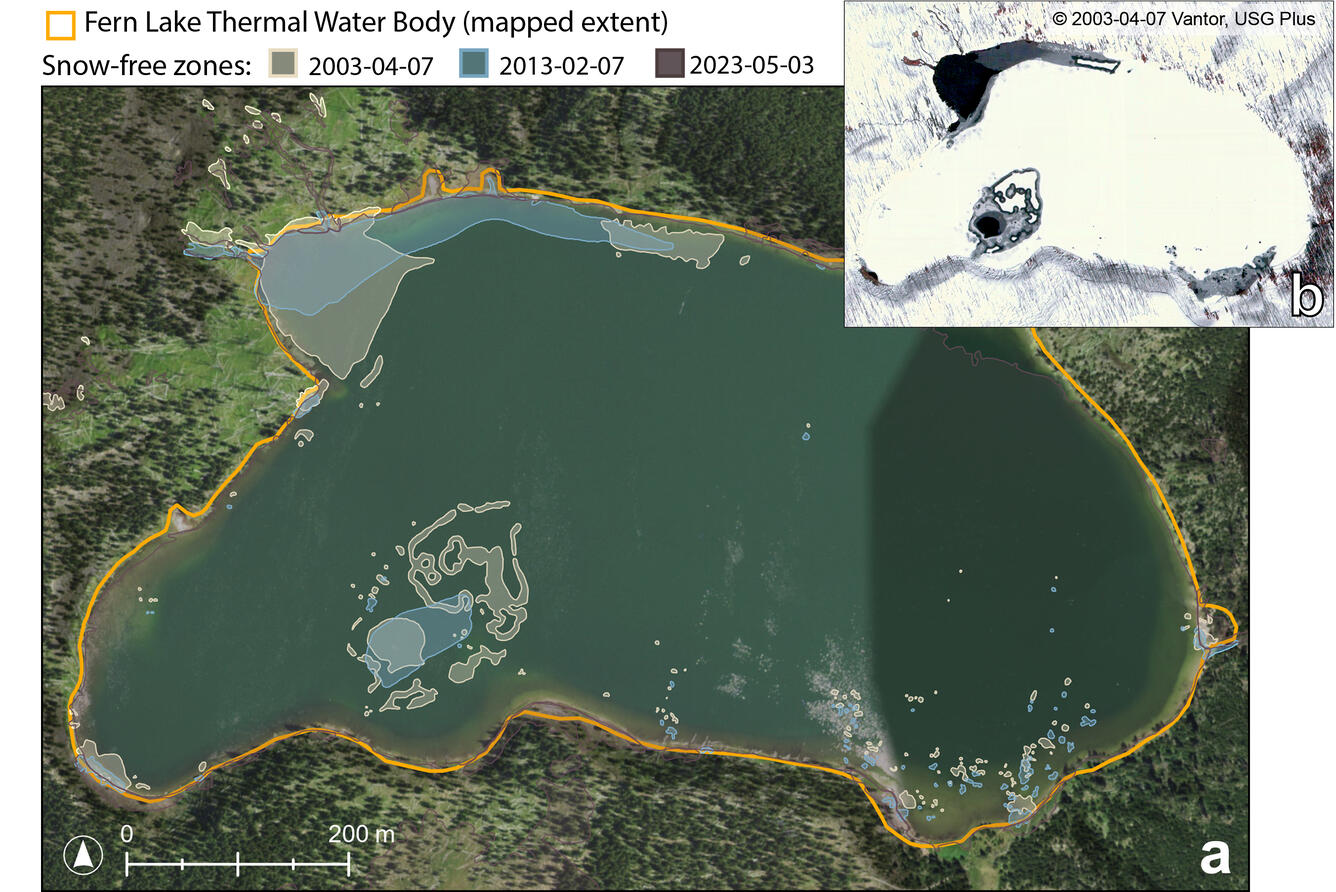
Mapping snow- and ice-free zones each season using wintertime satellite imagery not only helps to develop an overall understanding of thermal activity and changes over time, but also can contribute to discovering previously unrecognized areas with thermal activity both on land and beneath some lakes. Using this mapping method means having to go through a lot of satellite imagery to find wintertime scenes during periods of heavy snow cover that are also free of clouds. Fortunately, this procedure can largely be automated. After scenes are downloaded, they are orthorectified to a consistent pixel grid covering the entirety of Yellowstone and clipped to encompass known thermal area boundaries and then processed to create color images with sub-meter pixels. Once these steps are complete, mapping of bare ground and unfrozen water in wintertime scenes can be done by YVO scientists. This has now been accomplished for time periods extending back to 2002. The results revealed several previously unmapped thermal areas and will be used to update the existing database of thermal area maps for Yellowstone National Park. These data also help geologists to better target field surveys of thermal areas by prioritizing locations showing persistent signs of thermal activity.
YVO will continue wintertime mapping of Yellowstone’s thermal areas using data from high-resolution commercial satellites, which will help fill gaps in areas for which good wintertime satellite data have not yet been acquired, as well as to monitor the same locations across seasons and years. The more times the same location is mapped showing thawed ground or ice-free water, the more geologists can be confident that the location is experiencing persistent surface thermal activity. There is plenty more work still to be done, and YVO is excited to continue sharing insights from this project in the future!