What do Yellowstone and the 2026 FIFA Men’s World Cup have in common? Heat maps!
Heat is everywhere—from the boiling hot springs and fumaroles of Yellowstone to the fast-paced action of the 2026 FIFA Men’s World Cup. In both settings, scientists and analysts use heat maps to visualize activity, whether it's geothermal energy or the positions of players on the field. How are these maps made, and what do they reveal about their respective domains?
Yellowstone Caldera Chronicles is a weekly column written by scientists and collaborators of the Yellowstone Volcano Observatory. This week's contribution is from R. Greg Vaughan, research scientist with the U.S. Geological Survey.
Heat maps are a tool for visualizing where activity is concentrated—whether it is bubbling hot springs in Yellowstone or players speeding down the soccer field (or pitch) at the World Cup.
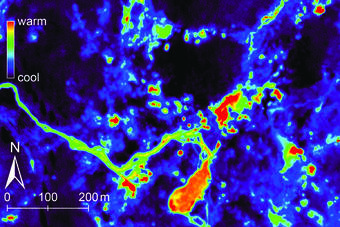
Yellowstone’s thermal areas are powered by geothermal heat from a cooling magma reservoir a few miles beneath the surface and are a constant reminder of the volcanic activity that has shaped the region. These areas also change frequently. Over time, thermal areas expand, contract, migrate, and sometimes new ones appear. Scientists from the Yellowstone Volcano Observatory monitor these dynamic areas and provide information to the National Park Service to help protect park resources and promote visitor safety.
In Yellowstone, scientists use remote sensing tools to create heat maps of thermal areas, revealing surface temperatures and variations in geothermal activity, and also highlighting features like hot springs and fumaroles. Thermal infrared imaging is a key technology used to capture the invisible warmth radiating from Yellowstone’s dynamic thermal areas. Both satellite and airborne thermal infrared images are used to map, measure, and monitor thermal areas.
Because there are some thermal areas that are too subtle to be detected with satellite thermal infrared data, scientists also use higher-resolution visible images from commercial satellites to look for snow-free zones in the wintertime. This technique allows smaller and/or more subtle thermal zones to be identified and mapped.
The resulting heat maps highlight areas of more intense geothermal activity (higher surface temperatures), helping scientists understand Yellowstone’s ever-changing landscape.
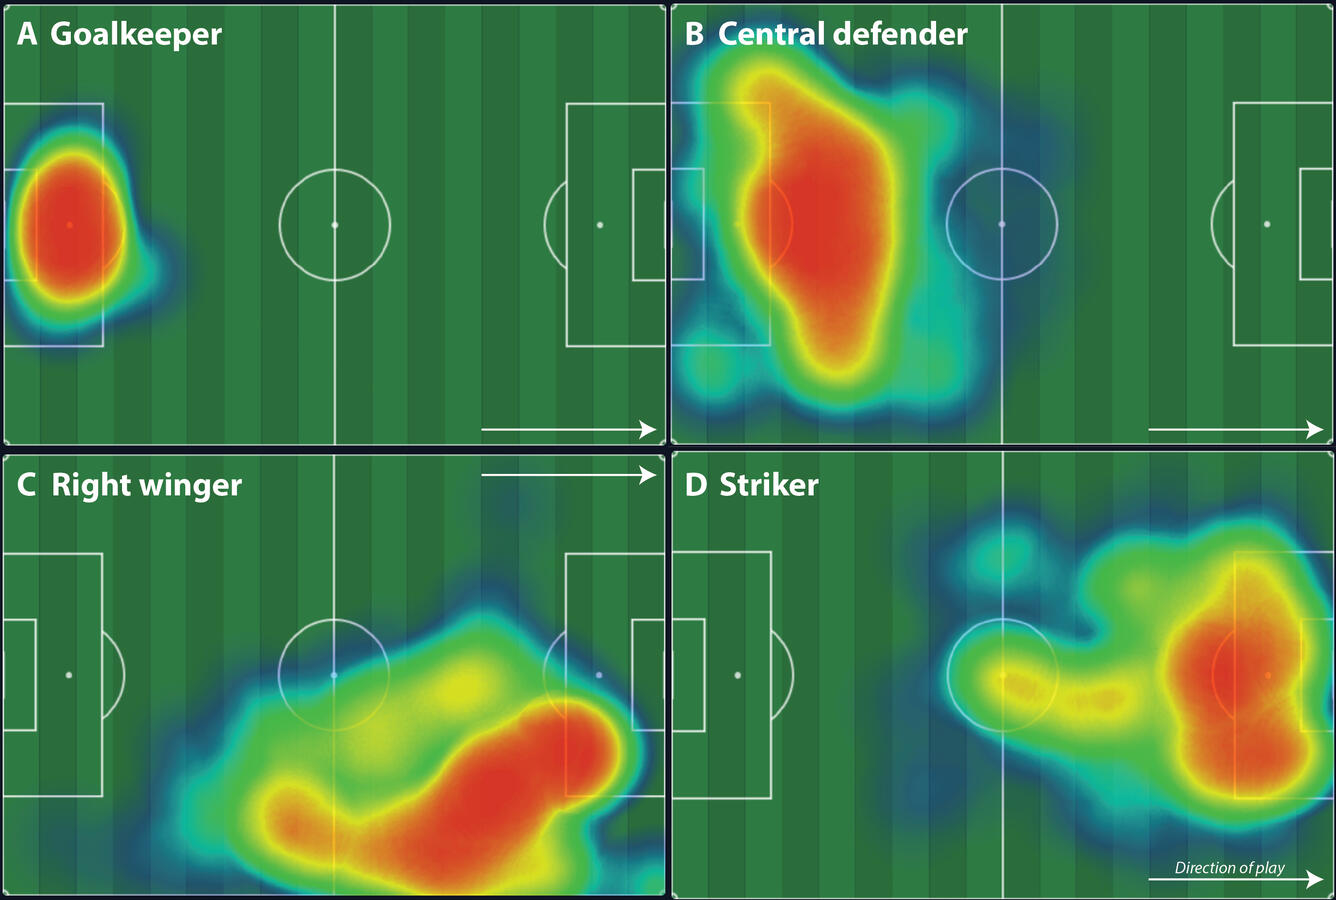
What does this have to do with soccer (or football, as most of the world outside the USA calls it)? On the soccer field, there are 22 players (11 per team) who are moving almost constantly. It’s like a game of chess where all the pieces are free to move in any direction at any time. There are, however, players in certain positions that hold certain tactical roles, and who often have certain specialized skills and abilities. For example, a striker—primarily an attacking player—spends most of their time in their attacking third of the field, close to the opponent’s goal; a central defender spends most of their time on the back line, trying to prevent the opponent from creating scoring chances; and of course, goalkeepers position themselves in front of the goal they are protecting and don’t usually venture very far away.
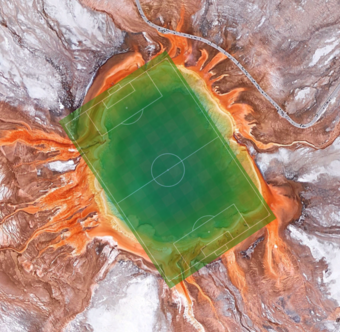
(By the way, a FIFA-regulation soccer field is 105 meters by 68 meter (115 yards by 74 yards), which is about the same size as Grand Prismatic Spring, the largest hot spring in Yellowstone National Park and the third largest hot spring in the world!).
In soccer, as well as other sports, players can wear trackers (using the same GPS technology that allows scientists to monitor ground deformation) that record their movements on the field. Alternatively, video feeds and optical tracking systems with player recognition software can be used to track each player’s movements throughout a game. These technologies can track player speed, direction, and cumulative distance covered, and ultimately can be used to generate heat maps that show where players spend most of their time—whether they're sprinting down the wing or battling for possession in the midfield. In this case, the heat maps are not showing actual heat, as is the case in Yellowstone, but rather where players spend the most time during a game.
Coaches and other team analysts can examine heat maps (for individual players or the entire team) and, combined with other statistics, they can optimize tactical strategies and evaluate player fitness and effectiveness. Heat maps can also be used to educate fans and young athletes about what areas of the field are typically covered by players in different positions, thus enhancing player development, and helping young athletes learn the fundamentals of the sport.
Despite their distinct applications, both types of heat maps rely on modern technology, data collection, and visualization techniques that transform complex activity into accessible insights. In Yellowstone, heat maps guide scientific investigation and aid in safety. In soccer, they inform strategy and performance evaluation. Whether charting the unpredictable flux of geothermal energy or the dynamic plays of world-class athletes, heat maps illuminate hidden stories at the surface. So, next time you see a heat map of Yellowstone’s thermal areas or a player’s heat map during the World Cup, remember that both are windows into worlds of energy and motion that are revealed by science and technology.