
USGS Remote Sensing Data Tracks Coastal Change from Hurricanes Helene and Milton
In response to Hurricanes Helene and Milton, the USGS collected and released aerial imagery covering over 250 kilometers (155 miles) of the west coast of Florida.
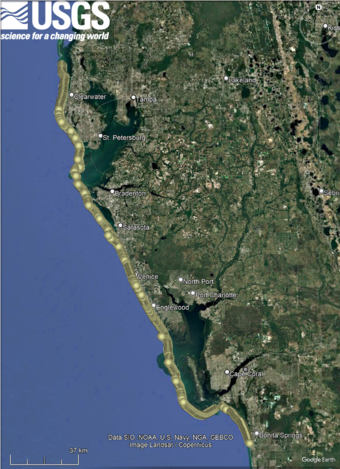
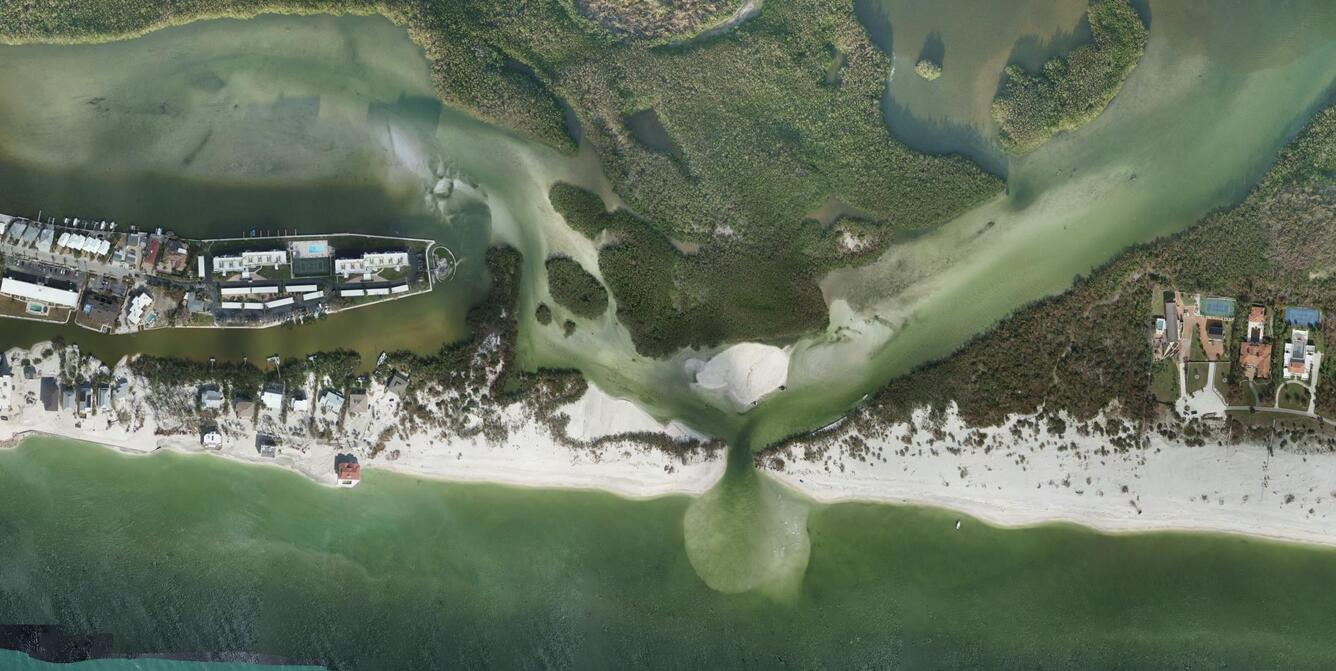
The survey documented coastal change from Honeymoon Island to Naples, Florida following the back-to-back storms, including heavily developed communities such as Captiva Island, Sanibel Island, and Fort Myers Beach, as well as undeveloped areas like Cayo Costa and Lovers Key State Beaches. Imagery was acquired on October 1-4, 2024, shortly after Helene made landfall near Big Bend on September 26, and again on October 16–22, 2024, after Milton came ashore near Sarasota on October 9. Flights were timed to capture immediate storm impacts before substantial cleanup and repairs began.
Researchers in the Remote Sensing Coastal Change (RSCC) project contracted an aircraft to fly along the shoreline, collecting thousands of overlapping photographs. Using Structure-from-Motion photogrammetry, they produced high-resolution orthomosaic images (map-like aerial views) and three-dimensional digital elevation models, enabling detailed measurement of landcover type and surface elevations. By comparing these products with pre-storm data collected in spring 2024, scientists can assess how the coastline changed and evaluate the accuracy of USGS coastal change forecasts.
Using these remote sensing techniques, the USGS can efficiently collect time-sensitive data to map and measure hurricane impacts along affected coastal regions, including:
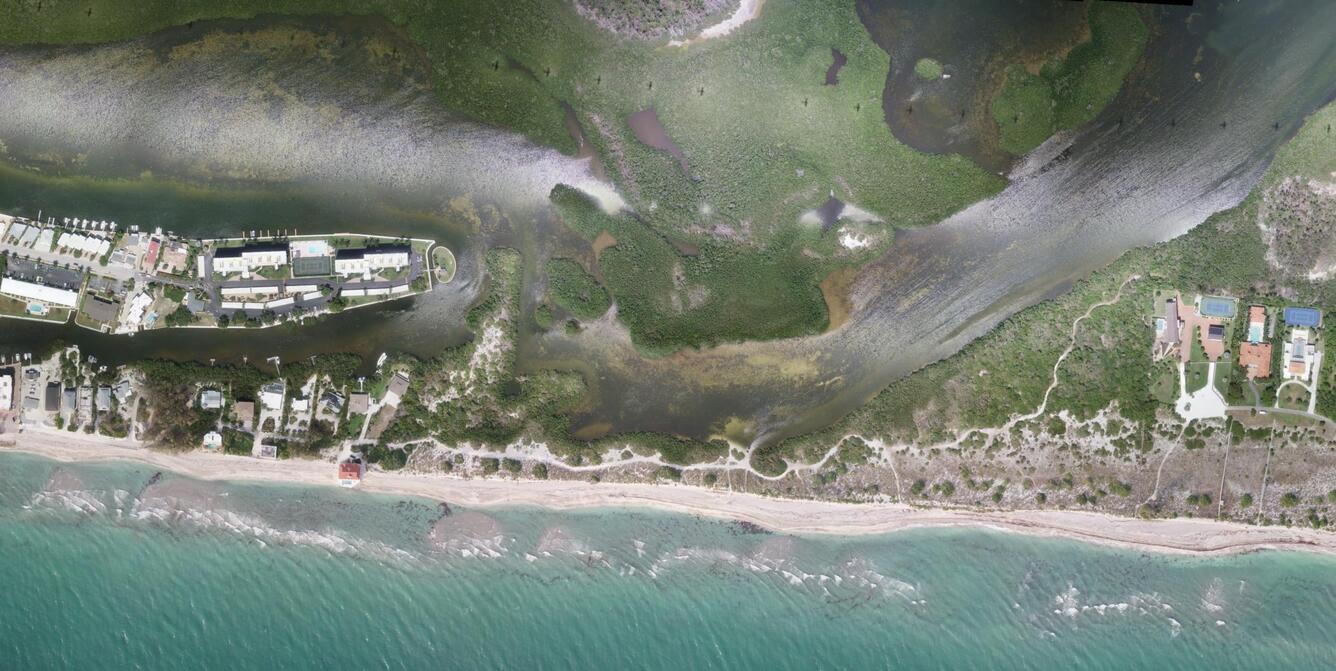
- Documenting infrastructure damage
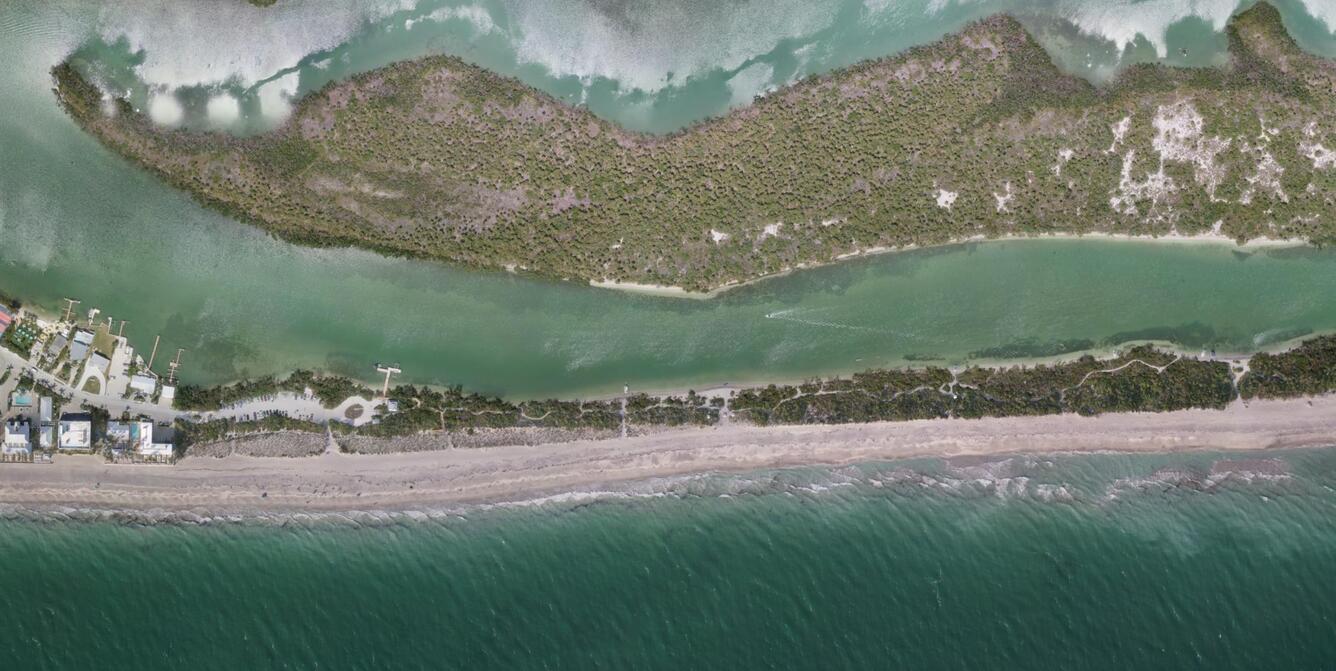
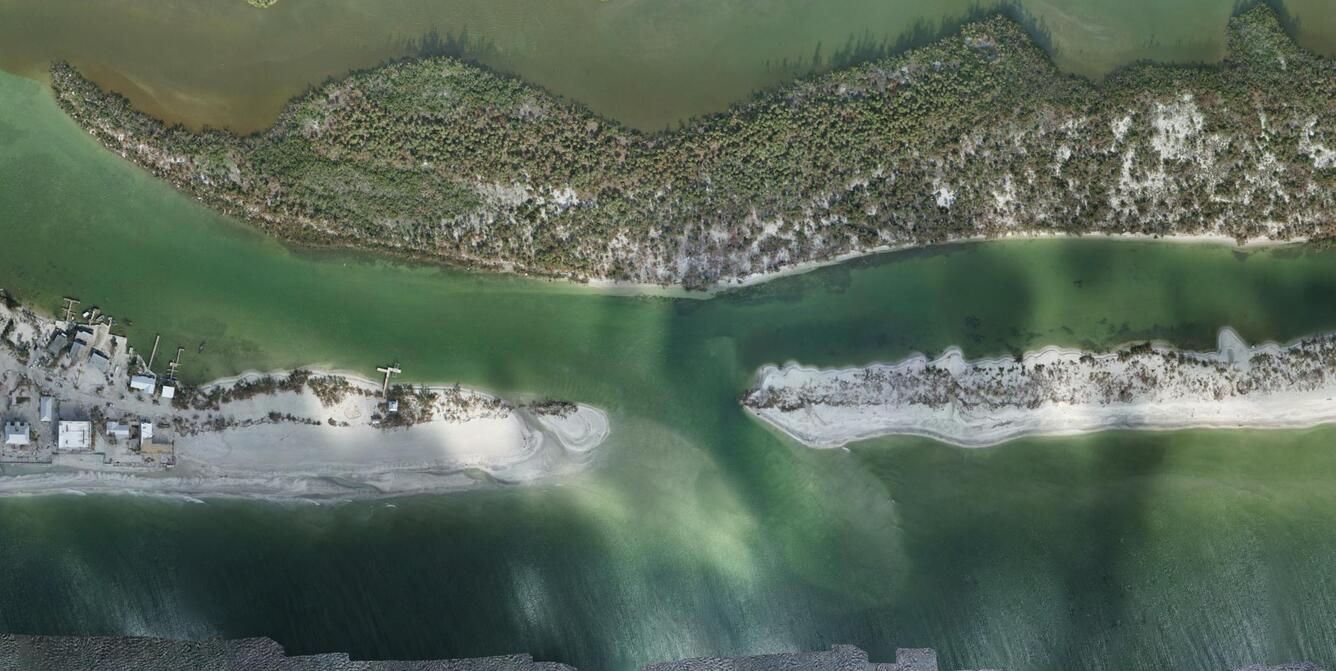
- Identifying overwash and barrier island breaches
- Mapping land cover changes
- Calculating erosion and sand deposition
- Updating coastal elevation metrics that indicate vulnerability
In the short term, the information assists partners, such as state agencies and the National Park Service, with response and recovery. Over the long term, it improves understanding of coastal dynamics, refines predictive models, and strengthens forecasts for future storms.
These data have been released under USGS Emergency Use Data authorities for data that have immediate or time-sensitive relevance to public health and safety. The aerial photos that were used to build these topographic data are published and available in the USGS Remote Sensing Coastal Change Simple Data Service, where you can also view raw aerial photo thumbnails and full-size browse images in KML finding aids.
Related

Remote Sensing Coastal Change
Related