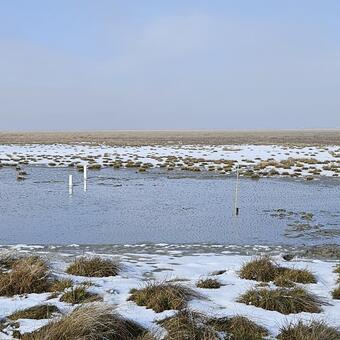
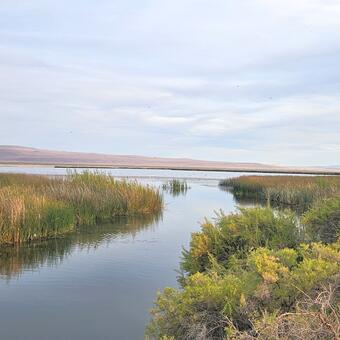
Across the Great Basin terminal lakes are shrinking in size, which decreases the suitable area of waterbird habitat. While use of limited water supply for home and crops contributes to lake level declines, changes in the forms of precipitation (snow vs rain) and increasing temperature and evaporation also affect changes in lake water supply. Identifying changes in water availability and their effects on waterbird habitat and use helps guide management decisions that balance water demands with lake levels to support ecosystem functions.
Long-term precipitation and temperature data were used to calculate drought metrics and trends across the Great Basin and for each terminal lake in the Saline Lake Ecosystems Integrated Water Availability study. Subsets of national datasets such as OpenET and the National Water Availability Assessment were used to calculate trends in surface water availability and use for Great Basin watersheds.
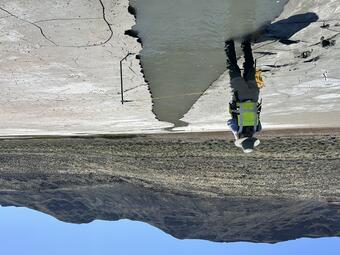
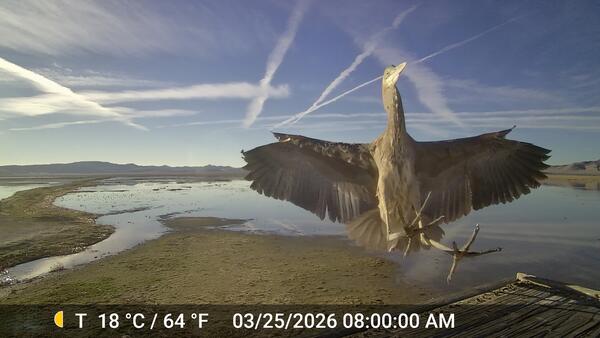
A major part of this study relates water availability data and trends to bird habitat use. We helped fill data gaps in evapotranspiration, inconsistent historical lake‑level records, lake bathymetry, and lakebed topography. Techniques and methods used to collect these data:
- Remotely sensed topobathymetric data
- Physical and chemical hydrologic sensors
- Timelapse imagery with game cameras
- Chemical analysis of water samples helped to quantify surface-water and groundwater inputs and determine the average age of lake waters.
This information was used to quantify the variability of water amounts over time and estimate how those changes may relate to available waterbird habitat.
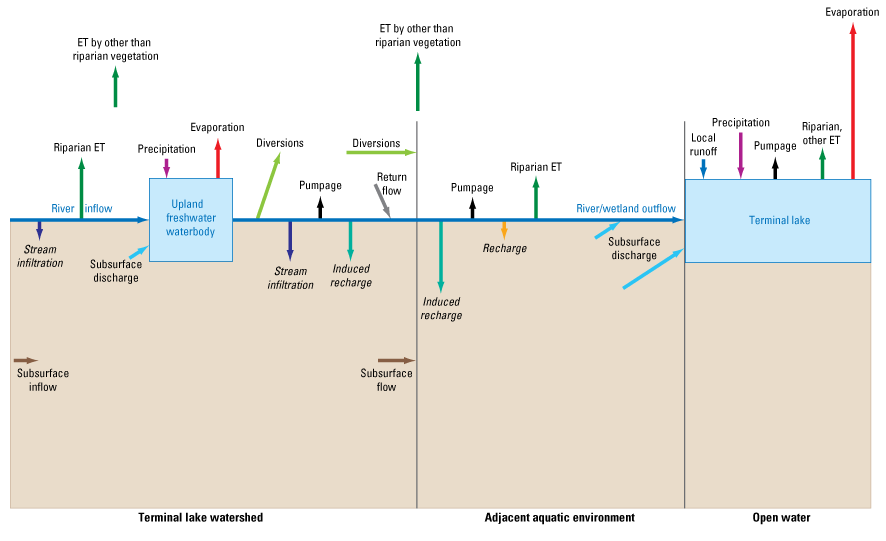
Terminal lake water budget components
Diagram of water inputs and outflows (fluxes) for water budgets of terminal lakes and their upland watershed. There are three geographic sections shown in this figure: 1) represented on the left is the upland portion of the terminal lake watershed which drains into the 2) adjacent aquatic environment and finally into 3) the terminal lake on the right.
Analyzing waterbird habitat dynamics
To map optimal waterbird habitat, we used water depth derived from remotely sensed topobathymetric data and related waterbird movement to changing lake levels.
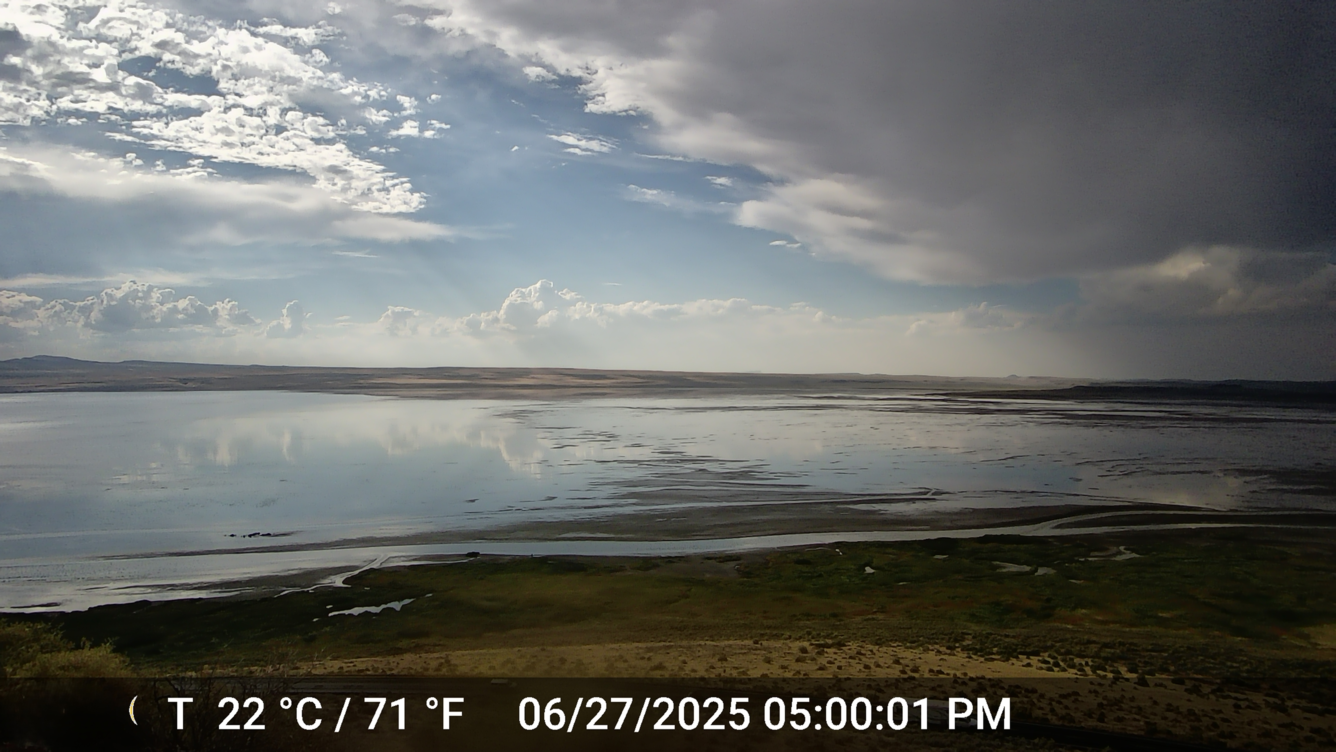
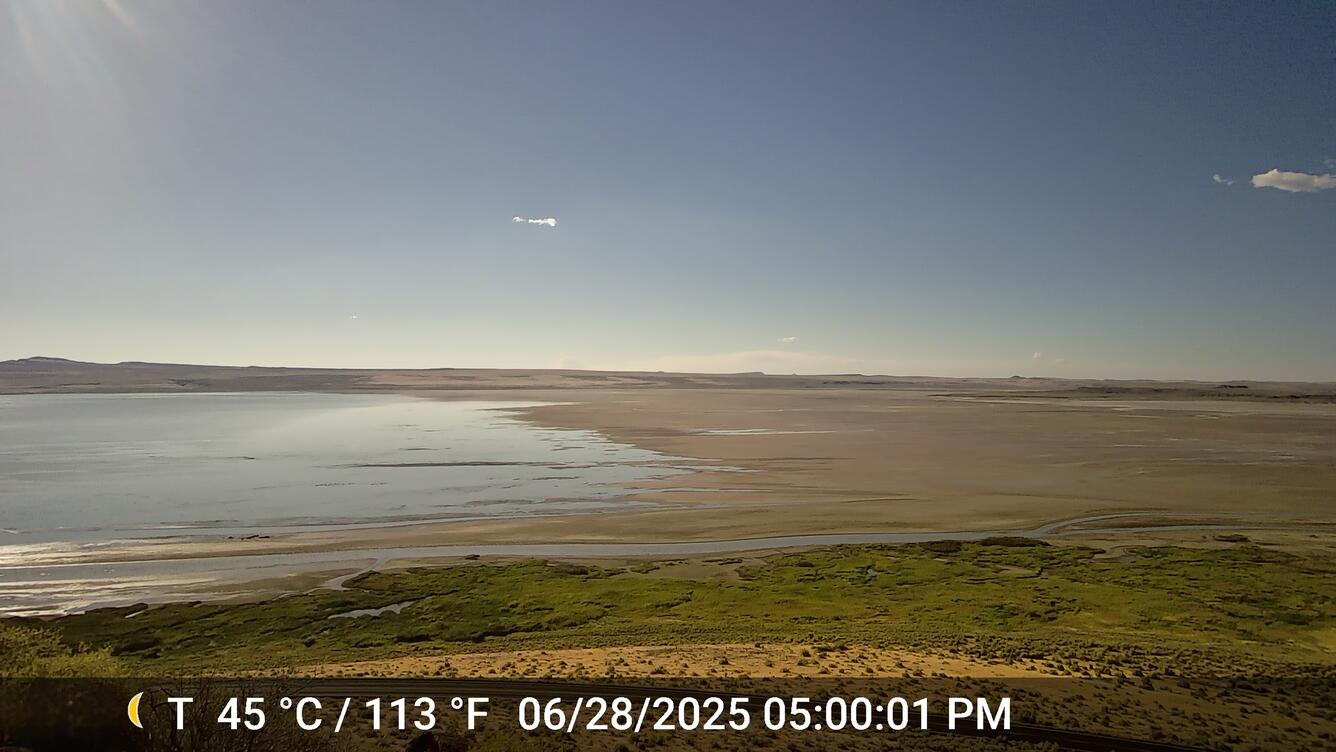
Water movement within selected terminal lakes was tracked using timelapse cameras set at key positions that allowed for assessing inflows and movements within lakes. Using images, we captured wind-driven seiche events. Seiches can cause extreme fluctuations to the shoreline, redistribute water across the landscape, and even shift lake water by miles in a single day.
Before-and-after images show Lake Abert shoreline changes over 24 hours resulting from a wind‑driven seiche event.
These images show a distinctive wind-driven seiche event in June 2025. On the left, shallow lake water stretches across the expanse of the camera view. On the right, the shoreline has shifted significantly to the left in just one day.