Stacked bar chart of 1990-2019 agriculture, domestic, and industry freshwater withdrawals in the U.S., estimated by the World Bank. In all years, industry withdraws the most freshwater, followed by agriculture and domestic. From 2006 to 2010, industrial water dropped 5,000 cubic kilometers, then remained low.
Jayaram Hariharan (Former Employee)
Science and Products
Stacked bar chart of 1990-2019 agriculture, domestic, and industry freshwater withdrawals in the U.S., estimated by the World Bank. In all years, industry withdraws the most freshwater, followed by agriculture and domestic. From 2006 to 2010, industrial water dropped 5,000 cubic kilometers, then remained low.
Circularity of named lakes in the U.S. A histogram shows circularity for lakes and reservoirs in the United States, defined as 4π * Area / perimeter squared. The distribution is skewed left, as most lakes and reservoirs aren’t very circular.
Reproducibility starts at the source: R, Python, and Julia Packages for retrieving USGS hydrologic data
Science and Products
Stacked bar chart of 1990-2019 agriculture, domestic, and industry freshwater withdrawals in the U.S., estimated by the World Bank. In all years, industry withdraws the most freshwater, followed by agriculture and domestic. From 2006 to 2010, industrial water dropped 5,000 cubic kilometers, then remained low.
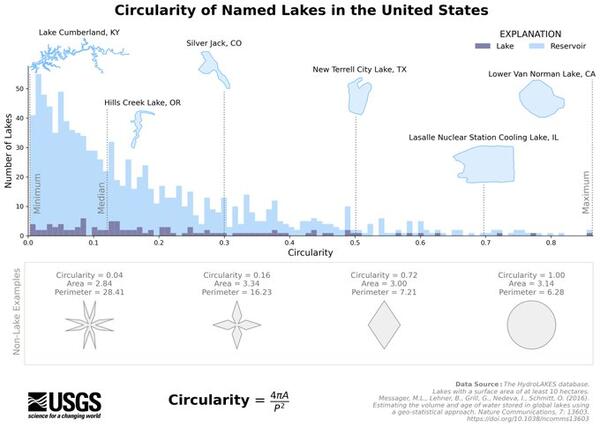
Circularity of named lakes in the U.S. A histogram shows circularity for lakes and reservoirs in the United States, defined as 4π * Area / perimeter squared. The distribution is skewed left, as most lakes and reservoirs aren’t very circular.