
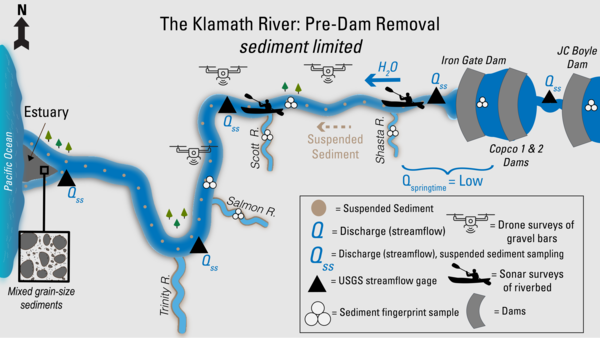
Before image: This illustration shows USGS work on the Klamath River and its main tributaries before the dams were removed. Iron Gate, Copco 1 and 2, and JC Boyle Dams blocked the river’s flow and trapped sediment. As a result, only small amounts of suspended sediment made it downstream, and springtime flows were low.
Lisa Hoaks (Former Employee)
Science and Products
I’ve helped draft and design numerous science project web pages to support public understanding of our work. I am not a researcher or the technical contact for these projects. Please see the project page for appropriate technical contacts.
Filter Total Items: 23

Understanding Groundwater in Oregon
Oregon Water Resources Department (OWRD) and U.S. Geological Survey (USGS) are working together to estimate groundwater recharge across the state.

Water-quality monitoring during reservoir drawdowns
The USGS is monitoring water-quality above, within, and below Middle Fork Willamette and the South Santiam River dams using field-based and remote-sensing approaches to understand how reservoir drawdowns influence downstream water-quality conditions.

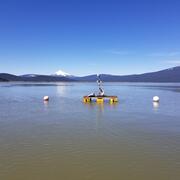
Oregon Water Science Center's Malheur Lake Portfolio
USGS scientists have partnered with local groups to learn about the processes affecting turbidity in Malheur Lake. Located in southeastern Oregon, Malheur Lake and the surrounding refuge provide critical habitat to birds migrating along the Pacific Flyway.

Modeling distributions of native Western Pearlshell and Western Ridged Mussels in the Willamette River Basin, western Oregon
The U.S. Geological Survey is working with Tribal, federal, state, and non-profit partners to understand and predict where native Western Pearlshell and Western Ridged mussels are found in the Willamette River Basin. Freshwater mussels provide critical ecosystem services to people but are imperiled world-wide. Findings will support freshwater mussel management and conservation in the Willamette...
The “Super Monitor”: Tracking Willamette River water quality in Portland
Nicknamed the ‘Super Monitor,’ this site has measured key water-quality values every 15 minutes since 2009.
Measuring Willamette River streamflow in Portland
Learn about one of Oregon's most relied upon streamflow gages.
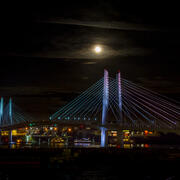
Willamette River Data Comes to Life Through Bridge Lighting
Did you know the colorful lighting on the Tilikum Crossing, Bridge of the People, is synced with U.S. Geological Survey water data from the Willamette River?
Integrating water availability in the Klamath Basin: from drought to dam removal
The USGS Water Resources Mission Area is assessing how much water is available for human and ecological needs in the United States and identifying where and when the Nation may have challenges meeting its demand for water. This information helps decision makers manage and distribute water in ways that balance competing needs. Due to its complex and competing water demands, ecological significance...
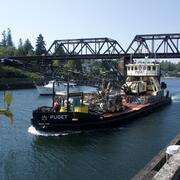
Lake Washington Ship Canal Sustainable Rivers Project
The U.S. Geological Survey (USGS) and the U.S. Army Corps of Engineers (USACE) are refining a water quality model to better understand temperature and salinity dynamics in the Lake Washington Ship Canal. This effort is supported by the Sustainable Rivers Program, a partnership between the USACE and The Nature Conservancy (TNC).

Waterbird Ecology and Movement in the Terminal Lakes Across the Great Basin
How do changing conditions in the terminal lakes of the Great Basin effect the migratory birds that depend on them? USGS scientists investigate bird movement and habitat use to find out.

Evaluating sediment transport in Chicken Creek
The United States Geological Survey (USGS) is evaluating how the newly restored meandering channel on Chicken Creek affects sediment transport within the Tualatin River National Wildlife Refuge.

Bridge scour monitoring in Oregon
The U.S. Geological Survey is working with the Oregon Department of Transportation (ODOT) and Federal Highway Administration (FHWA) to revolutionize bridge scour monitoring using real-time sonar data collection and bathymetric surveying to remotely monitor sites, collect long-term data for evaluation, and develop and improve hydraulic models that predict scour.
Field work photos I've taken and storytelling media I put together.
Before image: This illustration shows USGS work on the Klamath River and its main tributaries before the dams were removed. Iron Gate, Copco 1 and 2, and JC Boyle Dams blocked the river’s flow and trapped sediment. As a result, only small amounts of suspended sediment made it downstream, and springtime flows were low.

Landsat imagery of Summer Lake
A sequence of satellite imagery of Summer Lake in southern Oregon from May 2024 – July 2024. Starting in May the lake is full and a deep-blue color. As the sequence of satellite images progresses through the summer the lake shrinks dramatically as water evaporates. By July the lake has dried out completely and only some marshlands remain.
A sequence of satellite imagery of Summer Lake in southern Oregon from May 2024 – July 2024. Starting in May the lake is full and a deep-blue color. As the sequence of satellite images progresses through the summer the lake shrinks dramatically as water evaporates. By July the lake has dried out completely and only some marshlands remain.

S.F. McKenzie River
Photo taken after measuring the streamflow volume on the South Fork McKenzie River, above Cougar Reservoir.
Photo taken after measuring the streamflow volume on the South Fork McKenzie River, above Cougar Reservoir.

Fall Creek above Tiller Creek near Lowell (14150250)
Fall Creek above Tiller Creek near Lowell (14150250)Fall Creek above Tiller Creek near Lowell (14150250). The U.S. Geological Survey monitors monitors water level, water temperature and air temperature at this location.
Fall Creek above Tiller Creek near Lowell (14150250)
Fall Creek above Tiller Creek near Lowell (14150250)Fall Creek above Tiller Creek near Lowell (14150250). The U.S. Geological Survey monitors monitors water level, water temperature and air temperature at this location.
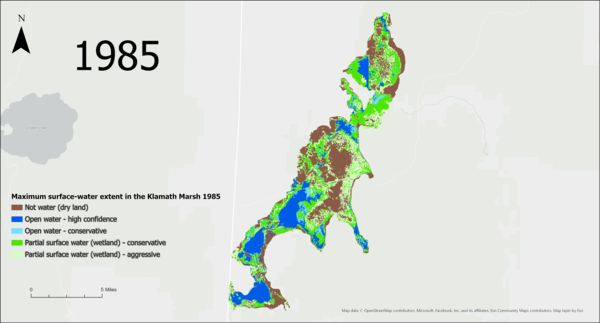
Klamath Marsh January through June maximum surface-water extent
Klamath Marsh January through June maximum surface-water extentColor-coded geospatial imagery overlaid on a grey-scale base map of the Klamath Marsh area. The images compare two different years that bracket the extent of the data set, 1985 and 2021. Brown-colored area shows dry land, dark-blue and light-blue areas have open water, dark-green and light-green areas are partial surface water wetlands.

Childrens Clean Water Festival
Lisa Hoaks and Carrie Boudreau ran an exhibit booth at the 2024 Children's Clean Water Festival. They presented an introduction to the Water Cycle with an interactive matching game along with a look at the USGS Streamer app to see where nearby rivers flow.
Lisa Hoaks and Carrie Boudreau ran an exhibit booth at the 2024 Children's Clean Water Festival. They presented an introduction to the Water Cycle with an interactive matching game along with a look at the USGS Streamer app to see where nearby rivers flow.

View from the cableway at Fall Creek, OR
Photo taken by Lisa Hoaks while she measured the streamflow of Fall Creek from the cableway. Looking downstream towards Unity Covered Bridge.
Photo taken by Lisa Hoaks while she measured the streamflow of Fall Creek from the cableway. Looking downstream towards Unity Covered Bridge.

Mckenzie River below Sahalie Falls
Looking upstream at Mckenzie River about 0.25 miles below Sahalie Falls. OWRSC has many stream gages in this area to help out EWEB cooperators.
Looking upstream at Mckenzie River about 0.25 miles below Sahalie Falls. OWRSC has many stream gages in this area to help out EWEB cooperators.
Science and Products
I’ve helped draft and design numerous science project web pages to support public understanding of our work. I am not a researcher or the technical contact for these projects. Please see the project page for appropriate technical contacts.
Filter Total Items: 23
Understanding Groundwater in Oregon
Oregon Water Resources Department (OWRD) and U.S. Geological Survey (USGS) are working together to estimate groundwater recharge across the state.
Water-quality monitoring during reservoir drawdowns
The USGS is monitoring water-quality above, within, and below Middle Fork Willamette and the South Santiam River dams using field-based and remote-sensing approaches to understand how reservoir drawdowns influence downstream water-quality conditions.
Oregon Water Science Center's Malheur Lake Portfolio
USGS scientists have partnered with local groups to learn about the processes affecting turbidity in Malheur Lake. Located in southeastern Oregon, Malheur Lake and the surrounding refuge provide critical habitat to birds migrating along the Pacific Flyway.
Modeling distributions of native Western Pearlshell and Western Ridged Mussels in the Willamette River Basin, western Oregon
The U.S. Geological Survey is working with Tribal, federal, state, and non-profit partners to understand and predict where native Western Pearlshell and Western Ridged mussels are found in the Willamette River Basin. Freshwater mussels provide critical ecosystem services to people but are imperiled world-wide. Findings will support freshwater mussel management and conservation in the Willamette...
The “Super Monitor”: Tracking Willamette River water quality in Portland
Nicknamed the ‘Super Monitor,’ this site has measured key water-quality values every 15 minutes since 2009.
Measuring Willamette River streamflow in Portland
Learn about one of Oregon's most relied upon streamflow gages.
Willamette River Data Comes to Life Through Bridge Lighting
Did you know the colorful lighting on the Tilikum Crossing, Bridge of the People, is synced with U.S. Geological Survey water data from the Willamette River?
Integrating water availability in the Klamath Basin: from drought to dam removal
The USGS Water Resources Mission Area is assessing how much water is available for human and ecological needs in the United States and identifying where and when the Nation may have challenges meeting its demand for water. This information helps decision makers manage and distribute water in ways that balance competing needs. Due to its complex and competing water demands, ecological significance...
Lake Washington Ship Canal Sustainable Rivers Project
The U.S. Geological Survey (USGS) and the U.S. Army Corps of Engineers (USACE) are refining a water quality model to better understand temperature and salinity dynamics in the Lake Washington Ship Canal. This effort is supported by the Sustainable Rivers Program, a partnership between the USACE and The Nature Conservancy (TNC).
Waterbird Ecology and Movement in the Terminal Lakes Across the Great Basin
How do changing conditions in the terminal lakes of the Great Basin effect the migratory birds that depend on them? USGS scientists investigate bird movement and habitat use to find out.
Evaluating sediment transport in Chicken Creek
The United States Geological Survey (USGS) is evaluating how the newly restored meandering channel on Chicken Creek affects sediment transport within the Tualatin River National Wildlife Refuge.
Bridge scour monitoring in Oregon
The U.S. Geological Survey is working with the Oregon Department of Transportation (ODOT) and Federal Highway Administration (FHWA) to revolutionize bridge scour monitoring using real-time sonar data collection and bathymetric surveying to remotely monitor sites, collect long-term data for evaluation, and develop and improve hydraulic models that predict scour.
Field work photos I've taken and storytelling media I put together.
Klamath dam removal conceptual model
Before image: This illustration shows USGS work on the Klamath River and its main tributaries before the dams were removed. Iron Gate, Copco 1 and 2, and JC Boyle Dams blocked the river’s flow and trapped sediment. As a result, only small amounts of suspended sediment made it downstream, and springtime flows were low.
Before image: This illustration shows USGS work on the Klamath River and its main tributaries before the dams were removed. Iron Gate, Copco 1 and 2, and JC Boyle Dams blocked the river’s flow and trapped sediment. As a result, only small amounts of suspended sediment made it downstream, and springtime flows were low.
Landsat imagery of Summer Lake
A sequence of satellite imagery of Summer Lake in southern Oregon from May 2024 – July 2024. Starting in May the lake is full and a deep-blue color. As the sequence of satellite images progresses through the summer the lake shrinks dramatically as water evaporates. By July the lake has dried out completely and only some marshlands remain.
A sequence of satellite imagery of Summer Lake in southern Oregon from May 2024 – July 2024. Starting in May the lake is full and a deep-blue color. As the sequence of satellite images progresses through the summer the lake shrinks dramatically as water evaporates. By July the lake has dried out completely and only some marshlands remain.
S.F. McKenzie River
Photo taken after measuring the streamflow volume on the South Fork McKenzie River, above Cougar Reservoir.
Photo taken after measuring the streamflow volume on the South Fork McKenzie River, above Cougar Reservoir.
Fall Creek above Tiller Creek near Lowell (14150250)
Fall Creek above Tiller Creek near Lowell (14150250)Fall Creek above Tiller Creek near Lowell (14150250). The U.S. Geological Survey monitors monitors water level, water temperature and air temperature at this location.
Fall Creek above Tiller Creek near Lowell (14150250)
Fall Creek above Tiller Creek near Lowell (14150250)Fall Creek above Tiller Creek near Lowell (14150250). The U.S. Geological Survey monitors monitors water level, water temperature and air temperature at this location.
Klamath Marsh January through June maximum surface-water extent
Klamath Marsh January through June maximum surface-water extentColor-coded geospatial imagery overlaid on a grey-scale base map of the Klamath Marsh area. The images compare two different years that bracket the extent of the data set, 1985 and 2021. Brown-colored area shows dry land, dark-blue and light-blue areas have open water, dark-green and light-green areas are partial surface water wetlands.
Childrens Clean Water Festival
Lisa Hoaks and Carrie Boudreau ran an exhibit booth at the 2024 Children's Clean Water Festival. They presented an introduction to the Water Cycle with an interactive matching game along with a look at the USGS Streamer app to see where nearby rivers flow.
Lisa Hoaks and Carrie Boudreau ran an exhibit booth at the 2024 Children's Clean Water Festival. They presented an introduction to the Water Cycle with an interactive matching game along with a look at the USGS Streamer app to see where nearby rivers flow.
View from the cableway at Fall Creek, OR
Photo taken by Lisa Hoaks while she measured the streamflow of Fall Creek from the cableway. Looking downstream towards Unity Covered Bridge.
Photo taken by Lisa Hoaks while she measured the streamflow of Fall Creek from the cableway. Looking downstream towards Unity Covered Bridge.
Mckenzie River below Sahalie Falls
Looking upstream at Mckenzie River about 0.25 miles below Sahalie Falls. OWRSC has many stream gages in this area to help out EWEB cooperators.
Looking upstream at Mckenzie River about 0.25 miles below Sahalie Falls. OWRSC has many stream gages in this area to help out EWEB cooperators.