
How Changing Snowmelt affects Water in the Western U.S.
In this activity students will investigate how snowpack acts as a natural water storage system and how changes in snow accumulation and melt timing affect streamflow and water availability in the Western United States.
How Changing Snowmelt affects Water in the Western U.S. - Lesson Plan [PDF]
From Snow to Flow - Data Visualization

How Changing Snowmelt affects Water in the Western U.S.
Objective:
Students will investigate how snowpack acts as a natural water storage system and how changes in snow accumulation and melt timing affect streamflow and water availability in the Western United States. Using a USGS interactive visualization and real monitoring data, students will analyze trends, interpret hydrologic variables, and evaluate downstream impacts on people and ecosystems. This activity aligns with Next Generation Science Standards for high school science education.
Next Generation Science Standards (NGSS) Standards:
- DCIs: ESS2.C: the roles of Water in Earth’s Surface Processes, ESS2.D: Weather and Climate, ESS3.A: Natural Resources, ESS3.D Global Climate Change
- CCCs: Cause and effect, stability and change, systems and systems models, Scale, Proportion, and Quantity
- SEPs: Developing and using models, analyzing and interpreting data, constructing explanations and designing solutions, engaging in argument from evidence.
Key Terms:
- Snowpack - Accumulated snow that stores water during the cold season in mountainous regions.
- Snow Water Equivalent (SWE) - The amount of liquid water contained in snowpack; used to estimate meltwater volume.
- Melt Timing (SM50) - The date when half of the season’s maximum SWE has melted, measured as days since October 1.
- Soil Saturation - The amount of water held in soil, influencing infiltration and runoff.
- Streamflow - The volume of water moving through a stream or river over time.
- Water Availability - Combination of how much water is physically accessible (water quantity) and whether that water is safe to use (water quality).
- Water Year - A 12-month period from October 1 to September 30 used by hydrologists to track seasonal water processes.
Think - Individually
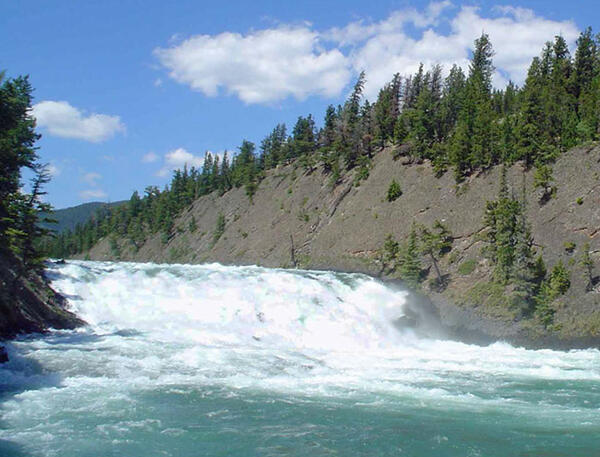
Much of the water in the western United States comes from snowmelt.
• Why might snow be considered a “frozen water tower”?
• What could happen if snow melts earlier than usual?
• Who depends on this snowmelt water downstream?
Using the following data visualization page from USGS VizLab to complete the activity.
https://labs.waterdata.usgs.gov/visualizations/snow-to-flow/index.html#/
Review - Pair or Group Discussion
After reading the passage on the page, ask students to define or discuss the following in pairs or groups. After reading the introduction text on the page, ask students to define or discuss the following in pairs or groups.
How do high elevation mountains store water through the cold season.
Why is the timing of snowmelt just as important as the amount of snow?
How does snowmelt connect soil, streams, ecosystems, and human water use?
Ask students to review the following snow-to-flow processes described in the visualization:
• Soil saturation affects whether meltwater infiltrates or runs off
• SWE determines how much water is available to melt
• SM50 shows when snowmelt happens
• Streamflow reflects how snowmelt moves downstream
1. How do these variables work together as a system to control water availability?
Analyze and Reflect - Answer individually or in small groups
Comprehension
Why does snowmelt produce a large pulse of streamflow in spring?
How do warmer temperatures affect both snow accumulation and melt timing?
Why might low snowpack combined with early melt lead to reduced water availability later in the year?
How could earlier snowmelt increase risks of drought, wildfire, or flooding?
Data Interpretation - Students should analyze the interactive graphs on the visualization webpage to answer the following:
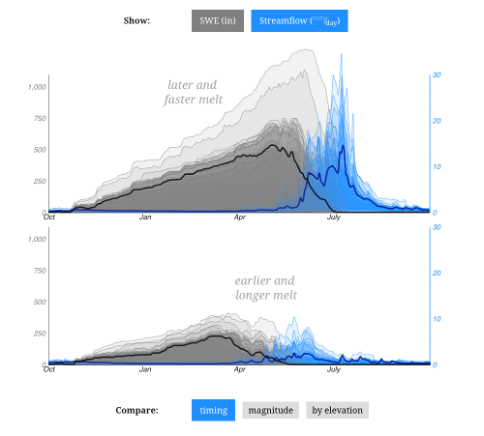
* Check the axis labels carefully and use the available chart tools to reorganize the data to determine your answer.
What does high peak SWE with late SM50 indicate about spring streamflow?
What happens to streamflow during low peak SWE and early melt years?
Compare Water Year 2011 and 2012. How did differences in snowpack affect streamflow downstream?
How does elevation influence snow accumulation and melt timing?
Why do hydrologists use a water year instead of a calendar year?
Challenge - Design a Water Management Response - Planning for Changing Snowmelt
Your community relies on snowmelt-fed rivers for drinking water, agriculture, and ecosystems. Recommend three actions water managers could take to adapt to changes in snowpack or snowmelt timing.
Students should justify their recommendations using evidence from the visualization and readings.
Applied Exploration
How Does the Amount of Snow Affect Streamflow?
Objective: Students will model how different amounts of snowpack (Snow Water Equivalent) affect:
- The volume of runoff
- The timing of runoff
- The duration of water availability
Students will use this physical model to explain how changes in snowpack influence streamflow and downstream water supply.
Materials (per group of 3–4 students):
- 3 shallow trays or aluminum baking pans
- Soil or sand (1–2 inches deep in each tray)
- Ice cubes or crushed ice
- Measuring cup (for meltwater collection)
- 3 clear containers (to catch runoff)
- Timer or stopwatch
- Ruler or scale (optional, for measuring ice)
- Paper towels
Set Up
Each tray represents a watershed with the same slope, soil, and temperature, but different snowpack amounts.
Tray Conditions
| Tray | Snow Amount (Ice) | Real-World Scenario |
| Tray A | Small amount (5 ice cubes) | Low SWE / dry winter |
| Tray B | Medium amount (10 ice cubes) | Average snow year |
| Tray C | Large amount (20 ice cubes) | High SWE / snowy winter |
(Teacher note: Emphasize that ice amount = SWE, not snow depth.)
Procedure:
- Prepare the Watersheds
- Fill each tray with the same amount of soil.
- Tilt each tray slightly using books so water can flow downhill.
- Place a collection container at the bottom of each tray.
- Add Snowpack (Ice)
- Place the correct number of ice cubes evenly across each tray.
Ensure ice placement is similar in all trays (spread out, not stacked).
- Simulate Snowmelt
- Start the timer as soon as ice begins to melt.
- Observe for 15–20 minutes.
Do not add water, melting occurs naturally at room temperature.
Observe and Measure, Students should record
- Time when runoff first appears
- How fast water flows
- Total volume of runoff collected
- How long runoff continues
Data Collection Table (Student Handout)
| Tray | Ice Amount | Time to First Runoff (min) | Total Runoff Volume (mL) | Runoff Duration (min) |
| A | Low | |||
| B | Medium | |||
| C | High |
Discussion Questions:
Observations
- Which tray produced runoff first?
- Which tray produced the most runoff?
Which tray produced runoff for the longest time?
Interpretation
How does increasing snow amount affect total streamflow?
How does snow amount affect how long water is available?
Which tray best matches:
- High peak SWE + late SM50?
- Low peak SWE + early SM50?
How does this experiment help explain:
- Reduced summer water supply after low snow years?
- Why is snowpack often called a “frozen reservoir”?
Optional Follow up:
Repeat the experiment with one of the pans with the now wet soil/sand.
- Describe the impact of soil moisture on runoff.
Helpful Links:
https://labs.waterdata.usgs.gov/visualizations/snow-to-flow/index.html - /
https://www.usgs.gov/water-science-school/science/snowmelt-runoff-and-water-cycle