
Using monitoring data to measure conditions over time in Chesapeake Bay streams
This study provides a comprehensive assessment of the health of streams throughout the Chesapeake Bay. Monitoring data were used to assess seven key indicators of stream condition, revealing consistent patterns of degradation in urban and agricultural areas. The findings offer critical insights that can inform watershed restoration efforts and improve long-term monitoring strategies.
USGS Study
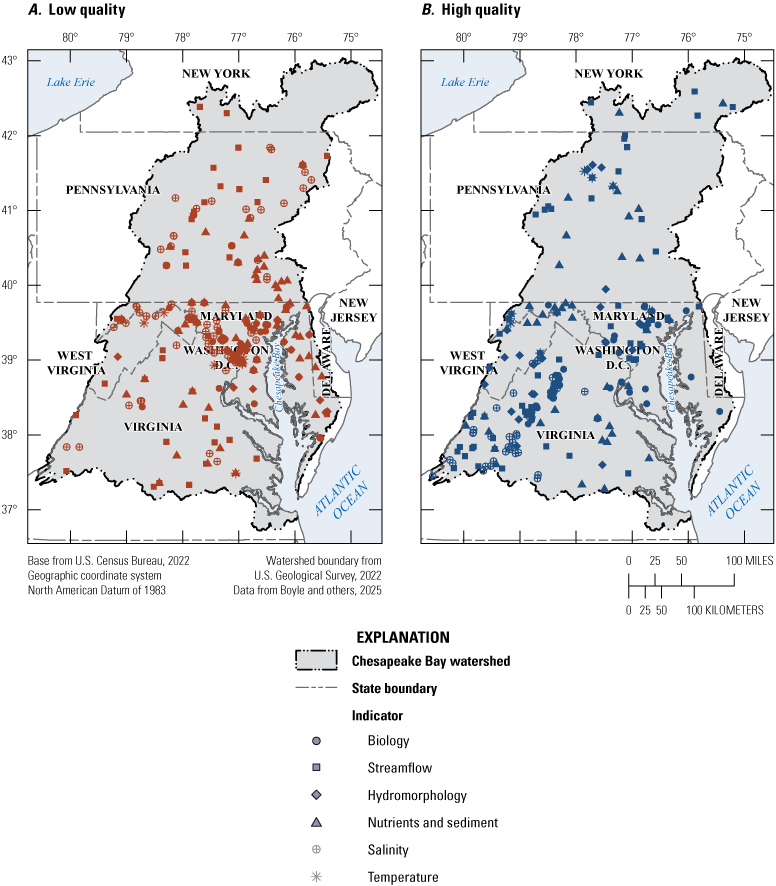
To support science-based management of the Chesapeake Bay watershed, the USGS conducted a comprehensive assessment of stream health by synthesizing monitoring data collected from over 1,000 stream locations (Figure 1). These data were used to assess the status (measured condition at a specific point in time) and trends (change in condition over time) of seven key indicators of stream health. These indicators represent measurements of nutrients, water temperature, salinity, toxic contaminants, streamflow, hydromorphology, and biological assemblages (fish and benthic macroinvertebrates). By integrating diverse datasets and analytical approaches, the study provides a foundational understanding of how stream health varies across the watershed and has changed over time.
Major Findings
- Stream health status, assessed across all indicators from 2015 to 2017, showed substantial variability across the watershed. Poorer condition scores were most frequently observed in urban and agricultural areas, particularly in developed regions like the Baltimore–Washington, D.C., metropolitan corridor. In contrast, forested areas—such as the Blue Ridge Mountains—more consistently aligned with high-quality condition scores across multiple indicators, including nutrients, salinity, stream temperature, habitat, and biological assemblage quality.
- Across the indicators with sufficient data for trend analysis, a greater proportion of stream locations showed degrading trends than improving ones. Degrading trends were most commonly observed for nutrient and sediment, salinity, stream temperature, and hydromorphology indicators.
- The location, frequency, and duration of monitoring data varied widely among indicators and across the watershed. These differences in spatial coverage, monitoring frequency, and time windows limited direct comparisons among indicators and prevented a unified assessment of watershed-wide trends.
- Spatial analysis of monitoring sites revealed imbalances in representation across stream sizes and land cover types. Most indicators, with the exception of biological assemblages, were disproportionately sampled in larger watersheds, leaving smaller streams underrepresented. Additionally, urban areas were oversampled relative to their prevalence in the watershed, while agricultural regions were comparatively underrepresented across most indicators.
Management Implications
Understanding how stream conditions change over time is essential for evaluating the success of restoration efforts and guiding future management decisions. The multi-indicator approach used in this study provides a comprehensive foundation for tracking progress toward improving stream health in the Chesapeake Bay watershed. This study also highlights opportunities to improve monitoring networks to better assess stream health. Biological assemblage data suitable for trend analysis were limited to the southern half of the watershed and few stream locations had paired data for multiple indicators, preventing multi-indicator analyses. Collecting biological data at long-term water-quality monitoring locations would greatly enhance future multi-indicator assessments of stream-health.
For More Information
The full study and associated data release can be found online at https://doi.org/10.3133/sir20255072.
This study provides a comprehensive assessment of the health of streams throughout the Chesapeake Bay. Monitoring data were used to assess seven key indicators of stream condition, revealing consistent patterns of degradation in urban and agricultural areas. The findings offer critical insights that can inform watershed restoration efforts and improve long-term monitoring strategies.
USGS Study
To support science-based management of the Chesapeake Bay watershed, the USGS conducted a comprehensive assessment of stream health by synthesizing monitoring data collected from over 1,000 stream locations (Figure 1). These data were used to assess the status (measured condition at a specific point in time) and trends (change in condition over time) of seven key indicators of stream health. These indicators represent measurements of nutrients, water temperature, salinity, toxic contaminants, streamflow, hydromorphology, and biological assemblages (fish and benthic macroinvertebrates). By integrating diverse datasets and analytical approaches, the study provides a foundational understanding of how stream health varies across the watershed and has changed over time.
Major Findings
- Stream health status, assessed across all indicators from 2015 to 2017, showed substantial variability across the watershed. Poorer condition scores were most frequently observed in urban and agricultural areas, particularly in developed regions like the Baltimore–Washington, D.C., metropolitan corridor. In contrast, forested areas—such as the Blue Ridge Mountains—more consistently aligned with high-quality condition scores across multiple indicators, including nutrients, salinity, stream temperature, habitat, and biological assemblage quality.
- Across the indicators with sufficient data for trend analysis, a greater proportion of stream locations showed degrading trends than improving ones. Degrading trends were most commonly observed for nutrient and sediment, salinity, stream temperature, and hydromorphology indicators.
- The location, frequency, and duration of monitoring data varied widely among indicators and across the watershed. These differences in spatial coverage, monitoring frequency, and time windows limited direct comparisons among indicators and prevented a unified assessment of watershed-wide trends.
- Spatial analysis of monitoring sites revealed imbalances in representation across stream sizes and land cover types. Most indicators, with the exception of biological assemblages, were disproportionately sampled in larger watersheds, leaving smaller streams underrepresented. Additionally, urban areas were oversampled relative to their prevalence in the watershed, while agricultural regions were comparatively underrepresented across most indicators.
Management Implications
Understanding how stream conditions change over time is essential for evaluating the success of restoration efforts and guiding future management decisions. The multi-indicator approach used in this study provides a comprehensive foundation for tracking progress toward improving stream health in the Chesapeake Bay watershed. This study also highlights opportunities to improve monitoring networks to better assess stream health. Biological assemblage data suitable for trend analysis were limited to the southern half of the watershed and few stream locations had paired data for multiple indicators, preventing multi-indicator analyses. Collecting biological data at long-term water-quality monitoring locations would greatly enhance future multi-indicator assessments of stream-health.
For More Information
The full study and associated data release can be found online at https://doi.org/10.3133/sir20255072.