
Geologic Records of High Sea Levels
Coral reef marine terraces
Talafofo Beach, Saipan
Coral/algal heads in an ancient reef
Oahu, Hawaii
Fossil coral reefs indicate earlier “high water mark”
Windley Key quarry, Florida
This project studies past high sea levels on coastlines that preserve fossil coral reefs or marine terraces. We ascertain the magnitudes of sea-level high stands by field mapping, stratigraphic measurements, and precise elevation measurements. Geochronology is accomplished by radiocarbon dating of mollusks (for Holocene-to-last-glacial deposits), uranium-series dating of corals (for high-sea stands back to about 500,000 years old) and strontium-isotope measurements of mollusks (for high-sea stands older than about 300,000 years). It is possible to determine the past water temperatures of the oceans during these high sea stands by detailed paleozoogeographic interpretations of fossil mollusk assemblages, a time-tested traditional method of paleoclimatic studies in marine settings. We also study the effects of sea level changes on coastal river systems and dunes.
The geomorphic record of sea level change on an uplifting coastline

On a tectonically active coast, such as California, changes in sea level are recorded as marine terraces, wave-cut benches that formed in the surf zone during interglacial periods, but are now above sea level due to uplift. Wave-cut benches also form during glacial periods, but these are offshore and underwater during interglacial periods. If uplift is continuous over time, a “stair step” type of landscape develops, as shown here, with each successively higher terrace corresponding to a successively older interglacial period.
[Reference: Imbrie, J., Hays, J.D., Martinson, D.G., McIntyre, A., Mix, A.C., Morley, J.J., Pisias, N.G., Prell, W.L., Shackleton, N.J., 1984, The orbital theory of Pleistocene climate: Support from a revised chronology of the marine δ18O record, in Berger, A., Imbrie, J., Hays, J., Kukla, G., and Saltzman, B., eds., Milankovitch and climate: Understanding the response to astronomical forcing: Dordrecht, D. Reidel Publishing Company, p. 269-305.]
The geomorphic record of sea level change on a stable or subsiding coastline

Why is this research important?
One of the most pressing issues in studies of climate change is the possible rise of sea level due to loss of major ice sheets, which would impact population, infrastructure, and habitats along the world's coastlines. It is not known which polar ice sheets (Greenland, West Antarctic, East Antarctic) are most at risk for mass loss that could contribute to sea level rise. Furthermore, it is not known what the possible magnitude of sea level rise is under interglacial climate conditions, how rapidly sea level may rise, or how long high sea levels may be retained. The goals of this project are to shed light on these questions by studying warm climate analogs of the geologic past.

How high was sea level during the last interglacial period?


Key unanswered questions about past interglacial sea levels
The research conducted by this project attempts to answer these questions raised in the Intergovernmental Panel on Climate Change (IPCC) 2014 report:
- The timing of past interglacial sea-level high stands
- Marine paleotemperatures during past high-sea stands
- Magnitudes of past interglacial high-sea stands
- Rates of sea level rise
Results
What have we learned from the last interglacial?
What fossil corals can tell us
Corals are the only organisms that take up uranium from the ocean. Thus, they are the only fossils that we can use for high-precision uranium-series dating, one of our major tools to determine ages of marine deposits.


How long did the last interglacial period last?
These maps show the places where we have found either fossil coral reefs (tropical locations) or coral-bearing marine terraces (California) that have been dated by uranium-series methods to the last interglacial period. On each map, you can see the range of ages we have gotten from dating these corals that tell us how long this high-sea stand lasted.


How high was sea level in the last interglacial period?


How warm was the ocean during the last interglacial period?
It is possible to determine the past water temperatures of the oceans during these high sea stands by detailed paleozoogeographic interpretations of fossil mollusk assemblages, a time-tested traditional method of paleoclimatic studies in marine settings. These maps show how marine invertebrates, now found only in warm waters farther south at present, expanded northward beyond their present ranges, during a warm last interglacial period.


This project studies past high sea levels on coastlines that preserve fossil coral reefs or marine terraces. We ascertain the magnitudes of sea-level high stands by field mapping, stratigraphic measurements, and precise elevation measurements. Geochronology is accomplished by radiocarbon dating of mollusks (for Holocene-to-last-glacial deposits), uranium-series dating of corals (for high-sea stands back to about 500,000 years old) and strontium-isotope measurements of mollusks (for high-sea stands older than about 300,000 years). It is possible to determine the past water temperatures of the oceans during these high sea stands by detailed paleozoogeographic interpretations of fossil mollusk assemblages, a time-tested traditional method of paleoclimatic studies in marine settings. We also study the effects of sea level changes on coastal river systems and dunes.
The geomorphic record of sea level change on an uplifting coastline
On a tectonically active coast, such as California, changes in sea level are recorded as marine terraces, wave-cut benches that formed in the surf zone during interglacial periods, but are now above sea level due to uplift. Wave-cut benches also form during glacial periods, but these are offshore and underwater during interglacial periods. If uplift is continuous over time, a “stair step” type of landscape develops, as shown here, with each successively higher terrace corresponding to a successively older interglacial period.
[Reference: Imbrie, J., Hays, J.D., Martinson, D.G., McIntyre, A., Mix, A.C., Morley, J.J., Pisias, N.G., Prell, W.L., Shackleton, N.J., 1984, The orbital theory of Pleistocene climate: Support from a revised chronology of the marine δ18O record, in Berger, A., Imbrie, J., Hays, J., Kukla, G., and Saltzman, B., eds., Milankovitch and climate: Understanding the response to astronomical forcing: Dordrecht, D. Reidel Publishing Company, p. 269-305.]
The geomorphic record of sea level change on a stable or subsiding coastline
Why is this research important?
One of the most pressing issues in studies of climate change is the possible rise of sea level due to loss of major ice sheets, which would impact population, infrastructure, and habitats along the world's coastlines. It is not known which polar ice sheets (Greenland, West Antarctic, East Antarctic) are most at risk for mass loss that could contribute to sea level rise. Furthermore, it is not known what the possible magnitude of sea level rise is under interglacial climate conditions, how rapidly sea level may rise, or how long high sea levels may be retained. The goals of this project are to shed light on these questions by studying warm climate analogs of the geologic past.
How high was sea level during the last interglacial period?
Key unanswered questions about past interglacial sea levels
The research conducted by this project attempts to answer these questions raised in the Intergovernmental Panel on Climate Change (IPCC) 2014 report:
- The timing of past interglacial sea-level high stands
- Marine paleotemperatures during past high-sea stands
- Magnitudes of past interglacial high-sea stands
- Rates of sea level rise
Results
What have we learned from the last interglacial?
What fossil corals can tell us
Corals are the only organisms that take up uranium from the ocean. Thus, they are the only fossils that we can use for high-precision uranium-series dating, one of our major tools to determine ages of marine deposits.
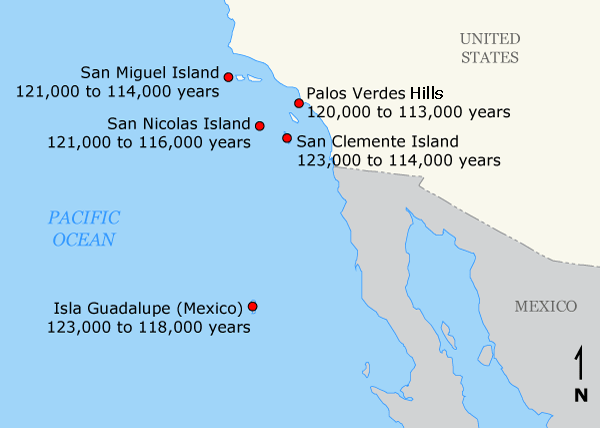
How long did the last interglacial period last?
These maps show the places where we have found either fossil coral reefs (tropical locations) or coral-bearing marine terraces (California) that have been dated by uranium-series methods to the last interglacial period. On each map, you can see the range of ages we have gotten from dating these corals that tell us how long this high-sea stand lasted.
How high was sea level in the last interglacial period?
How warm was the ocean during the last interglacial period?
It is possible to determine the past water temperatures of the oceans during these high sea stands by detailed paleozoogeographic interpretations of fossil mollusk assemblages, a time-tested traditional method of paleoclimatic studies in marine settings. These maps show how marine invertebrates, now found only in warm waters farther south at present, expanded northward beyond their present ranges, during a warm last interglacial period.