
Fall 2025 Newsletter - In The Flow
In this Fall 2025 edition: DC Metro July Flooding • Westernport Flooding Record • New Water Dashboard • New Gages • New Videos • New Publications
USGS Surveys Following July Flooding in DC Metro Area
On the afternoon of Saturday July 19, 2025, a storm dropped several inches of rain across the Washington, D.C. metro area, flooding a number of streets in the city and suburbs.
News reports showed flooded roads and emergency crews had to rescue people from vehicles. Sligo Creek flooded the adjacent parkway, reaching minor flood stage as defined by the National Weather Service.
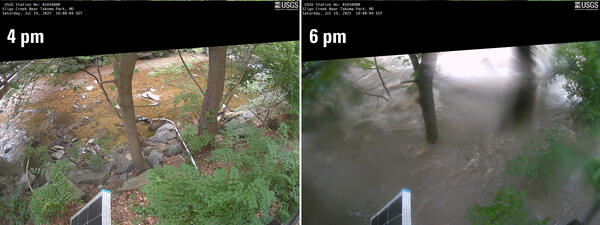
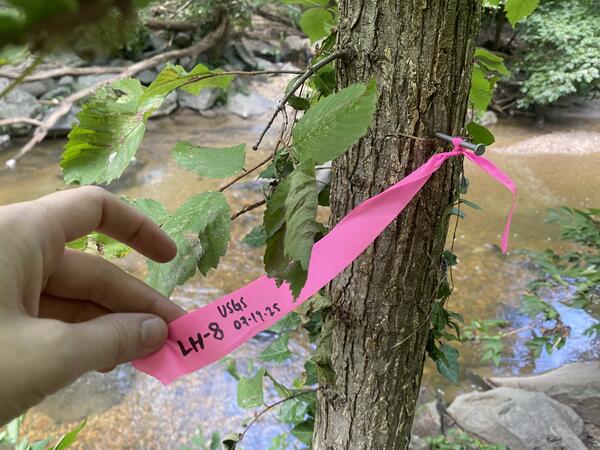
Afterwards, USGS crews surveyed at Sligo Creek near Takoma Park, MD, which set a new peak gage height of 7.52 ft. (provisionally), which if validated would surpass the previous peak of 7.26 ft. set in 2022. We will be able to calculate the resulting streamflow from the flagged high-water marks, data which is useful for the historical record.
Floods leave behind indications of how high the waters reached, and surveying these high-water marks contributes to the better understanding of flooding process and reduces risk through greater ability to estimate flood probability.
High water marks are used to verify hydrologic model analyses at targeted reaches of rivers and streams, which in turn are used for the construction of flood-inundation maps that are useful for land-use management, emergency management, and flood insurance rate determination. Hydrologic models are also used for flood warning systems, designing bridges and drainage structures, and other flood mitigation efforts.
May 2025 Georges Creek Flood Set New Stream Records
The USGS surveyed Georges Creek immediately following the severe flooding that swept through Westernport, Maryland and other towns in Western Maryland. In data released by the USGS, we found that at their peak on May 13, 2025, the floodwaters reached a water-level (gage height) of 14.10 ft. and a streamflow (discharge) of 9,400 cubic feet per second (cfs).
These numbers are new record highs for a site that the USGS has continuously monitored since 1929.
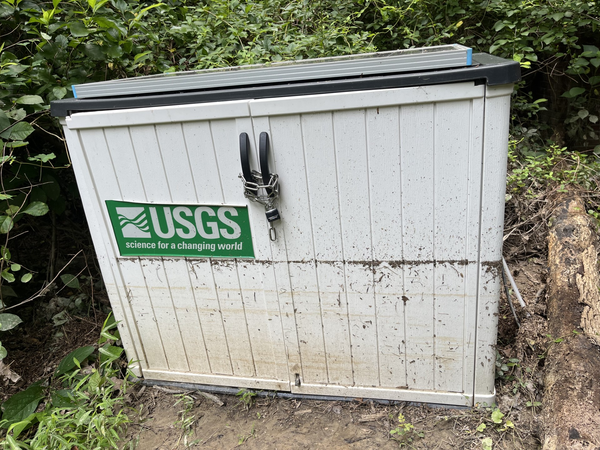
Although the USGS routinely surveys after flooding, this survey was especially important because the flood temporarily knocked out our streamgage instrumentation. Our technicians were able to reconstruct what occurred using high-water marks, and you can watch our video on that survey.
New Water Data for the Nation Landing Page
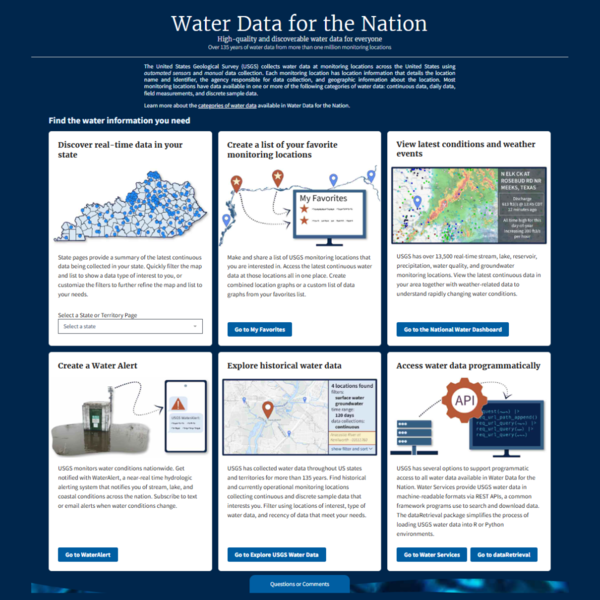
The USGS is excited to announce a new home page for Water Data for the Nation at waterdata.usgs.gov. The WDFN Home page will serve as a landing page and central hub for the WDFN ecosystem.
This home page replaces the legacy home page and helps to direct users to common features of interest as identified on each tile card.
All previously offered data are still navigable through this new homepage; however, our most popular and highly requested features are now available on WDFN Home.
Three Streamgages Restarted in Delaware
We restarted continuous water-level monitoring at three Delaware sites as of September 1, 2025:
- Morgan Branch near Dover, DE (01483620)
- Pipe Elm Branch near Dover, DE (01483625)
- Unnamed Pond at Dover Air Force Base at Dover, DE (01483745)
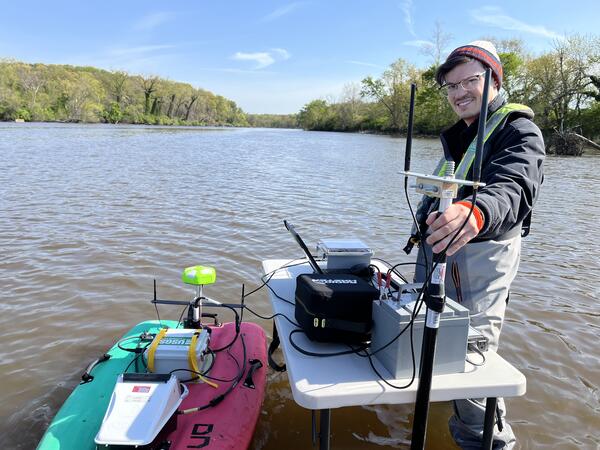
Our award-winning short video series “USGS On The Road” returns for a fourth installment. Learn more about how we used an autonomous boat to help us study the health of the Anacostia River and more!
Stay Up-To-Date On Our Latest Science
These are a selection of latest publications and data releases that our Center’s scientists contributed to: