
Streamflow Characteristics and Trends in New Jersey, Water Years 1897 - 2017
Streamflow statistics computed by the USGS are often utilized by water-resource managers to understand the streamflow conditions across New Jersey. For example, streamflow statistics can assist agencies with establishing minimum passing flows, evaluating or updating water withdrawal limits among other water-resource management activities to help protect water supply and the environment. The periodic update of these statistics is an essential part of maintaining informed water-resource planning in New Jersey.
Introduction

Streamflow statistics computed from data collected at USGS streamgages across New Jersey are a necessary part of water-resource planning and the protection of our natural resources. Streamflow statistics provide information to help describe the conditions in the rivers and streams across the state and document changes that may occur over time. Using scientific data such as streamflow statistics allows planners and state agencies to establish or update surface-water withdrawal limits to help protect the natural habitat and resources of New Jersey while still planning for future water-supply needs. These statistics may also be used for waste-load allocations and to analyze the impacts of non-point source discharges to streams. In addition, the variability of flow (low, high, and peak) and flow trends can alter riparian habitat which can affect stream ecosystems. Since streamflow can be influenced by both human activities and climate variability, it is important for future water-supply planning and regional watershed managers to understand potential reasons for trends in streamflow to develop and implement good management strategies.
The USGS New Jersey Water Science Center completed a study in 2024 to compute updated statistics and trends at continuous- and partial-record streamgages across New Jersey. The study results are summarized in the recently published scientific report: “Streamflow Characteristics and Trends in New Jersey” (McHugh and others, 2024, USGS Science Investigative Report SIR 2024-5099). The report summarized streamflow statistics at continuous- and partial-record streamgages for the period of 1897-2017. The associated data and statistics are available in a companion data release: “Streamflow characteristics and trends at continuous-record and partial-record streamflow-gaging stations in New Jersey, water years 1903-2017” (Williams and others, 2024)
A map of the continuous- and partial-record streamgages used in the study are shown below.
Project Objective

The objective of this project was to update previously published streamflow statistics for New Jersey including additional years of record at many streamgages used in the previous study, adding new streamgages that now meet minimum years of record requirements, and testing for trends in annual streamflow statistics. Extending the available dataset and computing and evaluating updated statistics will assist agencies like NJDEP plan management strategies for the watershed management areas of New Jersey. Assessing if steamflows are statistically changing around the state provides NJDEP with current information to help address priority issues related to water quality and quantity.
The vast amount of streamflow information collected through 2017 was summarized with high and low flow frequency, duration, and annual descriptive statistics. Tests for possible trends in streamflow at both continuous-record and partial-record streamgages were performed. The previous work of Watson and others, 2005, only summarized trends at continuous-record streamgages. Base-flow separation of hydrographs were performed on all continuous-record streamgages so that a long-term average of the sustained groundwater contribution of streamflow could be documented, as well as examined for trends. The base-flow values and a subset of frequency statistics were transferred to partial-record streamgages by regression as part of this project.
A data release which includes a geodatabase was produced with all basins delineated to organize and make available the massive amounts of information produced by the project (Streamflow characteristics and trends at continuous-record and partial-record streamflow-gaging stations in New Jersey, water years 1903-2017). The data release also included statistics from the earlier works of Watson and others, 2005 so that comparisons to past statistical analysis would be easier. The project team developed a web-based tool to make geographic display of the statistical results and trends easier for users to explore (New Jersey Streamflow Characteristics Web Mapper). Lastly, the overall methods and results of the project were summarized and published the USGS Scientific Investigations Report (SIR) titled Streamflow characteristics and trends in New Jersey, water years 1903–2017 (SIR 2024-5099).
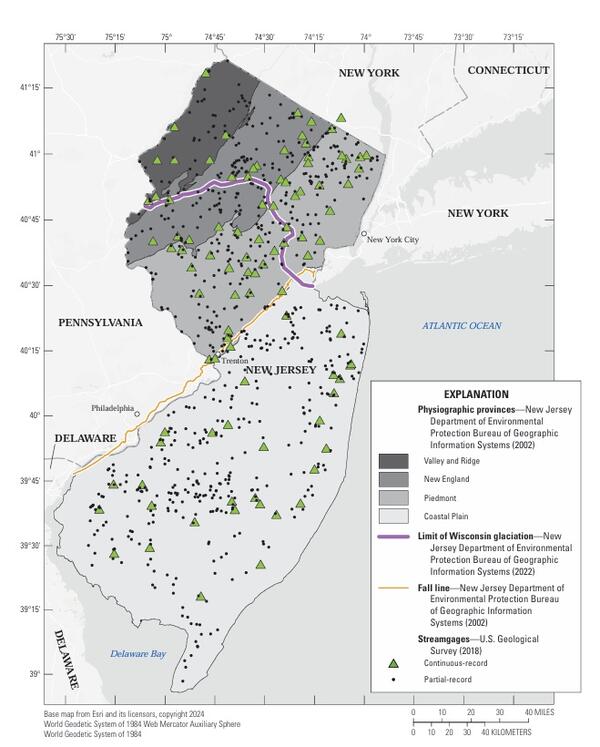
Stream gages included in analysis (Map):
- Continuous-record Streamgages - 97
- Partial-record streamgages – 719 of which 476 were used by Watson and others, 2005.
What Streamflow Statistics were calculated?
- Winter and summer n-day series and frequencies:
- High flow – 1-, 7-, 30-day series at 2-, 5-, 10-, and 25-year recurrence intervals
- Low flow 1-, 7-, 30-day series at 2-, 5-, 10-, and 20-year recurrence intervals
- Duration tables
- Period of Record (POR) statistics
- Maximum, minimum, mean annual flow
- Annual statistics
- Annual peak to 3-day mean ratio
- 25-75 flow duration ratio
- Trend tests of n-day series and annual statistics
- Annual variability in the form of a non-parametric coefficient of variation (IQR/Median; Watson and others, 2005 used parametric CV.)
- Annual baseflow (for trend analysis) and POR mean baseflow
- Trend tests of residuals of partial record site regressions
- Trends with consideration of Long-term Persistence and Short-term Persistence (Hodgkins, 2017)
All streamflow data used to calculate streamflow statistics are publicly available on USGS NWISWeb.
Below are other science projects associated with this project.

Streamflow characteristics and the basis for ecological flow goals
Streamflow statistics computed by the USGS are often utilized by water-resource managers to understand the streamflow conditions across New Jersey. For example, streamflow statistics can assist agencies with establishing minimum passing flows, evaluating or updating water withdrawal limits among other water-resource management activities to help protect water supply and the environment. The periodic update of these statistics is an essential part of maintaining informed water-resource planning in New Jersey.
Introduction
Streamflow statistics computed from data collected at USGS streamgages across New Jersey are a necessary part of water-resource planning and the protection of our natural resources. Streamflow statistics provide information to help describe the conditions in the rivers and streams across the state and document changes that may occur over time. Using scientific data such as streamflow statistics allows planners and state agencies to establish or update surface-water withdrawal limits to help protect the natural habitat and resources of New Jersey while still planning for future water-supply needs. These statistics may also be used for waste-load allocations and to analyze the impacts of non-point source discharges to streams. In addition, the variability of flow (low, high, and peak) and flow trends can alter riparian habitat which can affect stream ecosystems. Since streamflow can be influenced by both human activities and climate variability, it is important for future water-supply planning and regional watershed managers to understand potential reasons for trends in streamflow to develop and implement good management strategies.
The USGS New Jersey Water Science Center completed a study in 2024 to compute updated statistics and trends at continuous- and partial-record streamgages across New Jersey. The study results are summarized in the recently published scientific report: “Streamflow Characteristics and Trends in New Jersey” (McHugh and others, 2024, USGS Science Investigative Report SIR 2024-5099). The report summarized streamflow statistics at continuous- and partial-record streamgages for the period of 1897-2017. The associated data and statistics are available in a companion data release: “Streamflow characteristics and trends at continuous-record and partial-record streamflow-gaging stations in New Jersey, water years 1903-2017” (Williams and others, 2024)
A map of the continuous- and partial-record streamgages used in the study are shown below.
Project Objective
The objective of this project was to update previously published streamflow statistics for New Jersey including additional years of record at many streamgages used in the previous study, adding new streamgages that now meet minimum years of record requirements, and testing for trends in annual streamflow statistics. Extending the available dataset and computing and evaluating updated statistics will assist agencies like NJDEP plan management strategies for the watershed management areas of New Jersey. Assessing if steamflows are statistically changing around the state provides NJDEP with current information to help address priority issues related to water quality and quantity.
The vast amount of streamflow information collected through 2017 was summarized with high and low flow frequency, duration, and annual descriptive statistics. Tests for possible trends in streamflow at both continuous-record and partial-record streamgages were performed. The previous work of Watson and others, 2005, only summarized trends at continuous-record streamgages. Base-flow separation of hydrographs were performed on all continuous-record streamgages so that a long-term average of the sustained groundwater contribution of streamflow could be documented, as well as examined for trends. The base-flow values and a subset of frequency statistics were transferred to partial-record streamgages by regression as part of this project.
A data release which includes a geodatabase was produced with all basins delineated to organize and make available the massive amounts of information produced by the project (Streamflow characteristics and trends at continuous-record and partial-record streamflow-gaging stations in New Jersey, water years 1903-2017). The data release also included statistics from the earlier works of Watson and others, 2005 so that comparisons to past statistical analysis would be easier. The project team developed a web-based tool to make geographic display of the statistical results and trends easier for users to explore (New Jersey Streamflow Characteristics Web Mapper). Lastly, the overall methods and results of the project were summarized and published the USGS Scientific Investigations Report (SIR) titled Streamflow characteristics and trends in New Jersey, water years 1903–2017 (SIR 2024-5099).
Stream gages included in analysis (Map):
- Continuous-record Streamgages - 97
- Partial-record streamgages – 719 of which 476 were used by Watson and others, 2005.
What Streamflow Statistics were calculated?
- Winter and summer n-day series and frequencies:
- High flow – 1-, 7-, 30-day series at 2-, 5-, 10-, and 25-year recurrence intervals
- Low flow 1-, 7-, 30-day series at 2-, 5-, 10-, and 20-year recurrence intervals
- Duration tables
- Period of Record (POR) statistics
- Maximum, minimum, mean annual flow
- Annual statistics
- Annual peak to 3-day mean ratio
- 25-75 flow duration ratio
- Trend tests of n-day series and annual statistics
- Annual variability in the form of a non-parametric coefficient of variation (IQR/Median; Watson and others, 2005 used parametric CV.)
- Annual baseflow (for trend analysis) and POR mean baseflow
- Trend tests of residuals of partial record site regressions
- Trends with consideration of Long-term Persistence and Short-term Persistence (Hodgkins, 2017)
All streamflow data used to calculate streamflow statistics are publicly available on USGS NWISWeb.
Below are other science projects associated with this project.