



Geospatial Data Collection in the Willamette River Basin
River imagery
We've captured thousands of river channel photos above and below the water
Collecting geospatial data from a whitewater cataraft
We’ve surveyed hundreds of river miles
A USGS geospatial data collection initiative in Oregon’s Willamette River Basin uses advanced remote sensing and on‑the‑ground measurements to map major rivers draining the Cascade Range. This work helps track how changing water resources and river channel conditions affect a wide array of water‑management needs, river hazards, recreational users, and habitat for ESA-listed spring Chinook salmon, winter steelhead and other native fish.
Topobathy LiDAR
Modular Airborne Camera Pod
Thermal Infrared Imagery
Mobile Monitoring Platforms
Overview
A major geospatial data collection and analysis initiative is in progress across Oregon’s Willamette Basin. This effort combines advanced remote sensing technologies and ground observations to generate spatially continuous data of river attributes. Mapping water depth, channel morphology, and stream temperature is useful for characterizing current conditions and tracking changes over time.
River channels are always changing - often slowly, and sometimes in sudden and noticeable ways. Seasonal flows, storms, shifting land, human activities and more reshape the channels and underwater features that make up a river. Tracking these changes in a cost‑ and time‑efficient way is important for understanding how they might affect river hazards, water availability, dam operations, drinking‑water facilities, fish habitats and other water‑management needs.
This information helps protect people, property, infrastructure and supports salmon recovery efforts. High‑resolution mapping can identify hazards like rapidly shifting gravel bars, logjams, bank erosion, and shallow navigation routes that can endanger boaters, complicate rescue operations, or damage bridges and water‑intake structures. These data also improve planning for floods, droughts, and debris flows - events that can disrupt drinking‑water supplies, hydropower facilities, and recreation access. High-resolution mapping is useful for quantifying habitat availability, tracking habitat changes, prioritizing river restoration, and other salmon recovery efforts.
Key objectives:
- Characterize river conditions across a diverse range of environments, from lowland river valleys to steep mountain streams.
- Inform water resources and fisheries management decisions by 1) providing high-resolution datasets that can support near-term planning and 2) creating mapping tools that enable affordable, efficient data collection in the future.
Methods and technologies:
Technology we’re using and developing to integrate geospatial data collected from boats, aircraft, and satellites and other platforms.
Topobathymetric lidar :
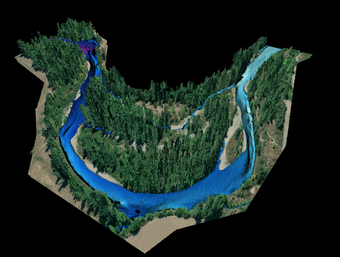
In partnership with the USGS 3D Elevation Program and U.S. Army Corps of Engineers, we’ve collected lidar on over ~600 kilometers of river corridors (2023–2025). Combined this with previous collections, now most major river corridors in the Willamette River Basin have topobathymetric lidar to support an array of hazard and habitat analyses.
Topobathymetric lidar of river corridors, integrated with land‑surface elevation data, is an important contribution to modeling the Nation in 3D. Integrated River mapping provides wide‑ranging benefits for both society and wildlife. Detailed mapping of riverbeds and banks enhances flood‑inundation modeling, bridge engineering, and drinking‑water protection. This work also supports ecosystem restoration, recreation planning, and water‑quality management.
3D National Topography Model | U.S. Geological Survey
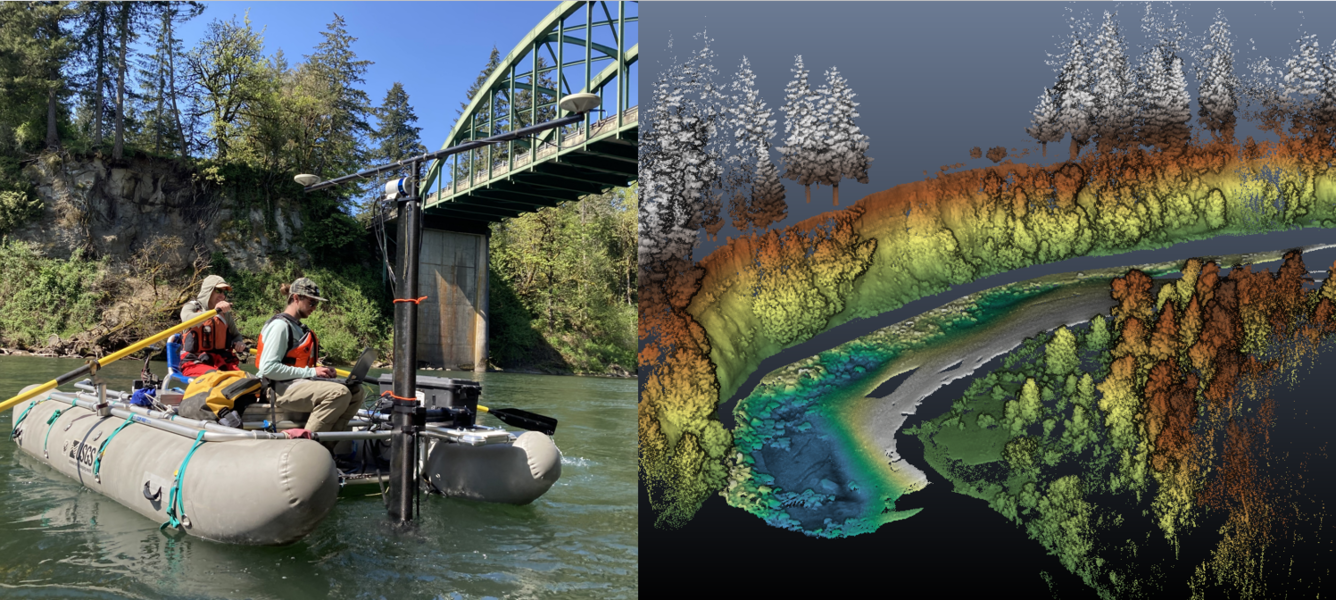
Clackamas River point cloud captured during a lidar survey from a whitewater cataraft:
Thermal infrared imagery:
In 2024, we captured thermal infrared imagery from a helicopter over roughly 170 kilometers of unregulated streams to assess stream temperature in critical habitats.
Water temperature is one of the most important environmental factors for determining survival of fish species. Water temperature plays a major role in fish survival throughout their life cycle, and thermal imagery helps reveal where colder groundwater enters the river and where fish may find cooler refuge during warm periods.
Thermal infrared imagery of the Little North Santiam and North Santiam Rivers:
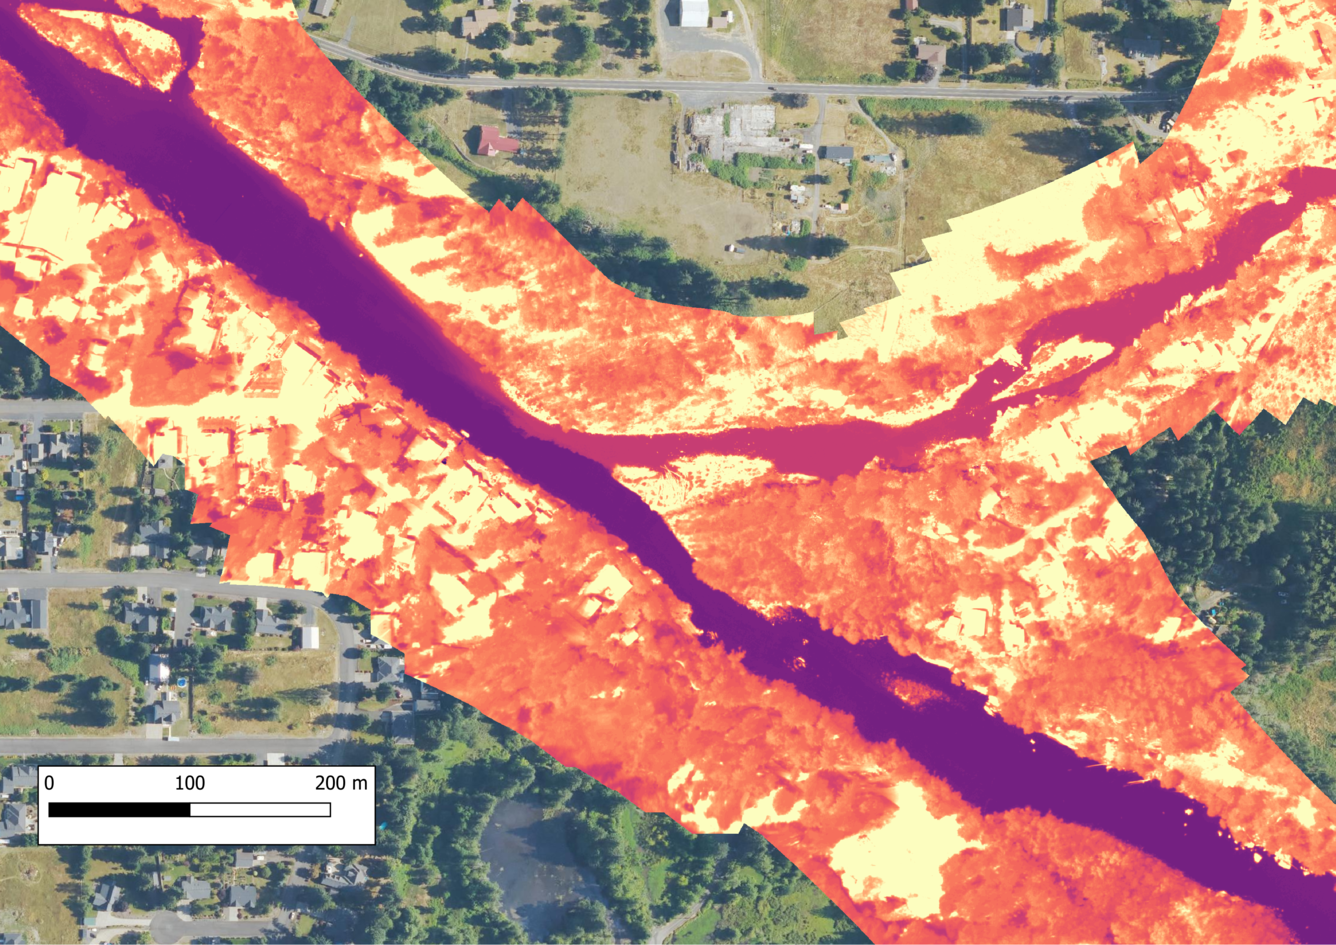
Thermal infrared (TIR) imagery from the 2024 Santiam River Basin survey, captured during helicopter‑based mapping. These data show surface water temperature patterns along the river, with darker colors indicating colder water. In this view, the Little North Santiam (lighter purple, warmer) is joining the North Santiam River (dark purple, colder).
Modular airborne camera pod:
We developed a modular airborne camera pod that can be mounted on a small aircraft. The pod has multispectral, thermal, and high‑resolution red-green-blue cameras. Remote‑sensing flights allow us to test these camera systems and collect imagery to map water depth, temperature, and velocity using both proven and emerging processing methods.
ORWSC staff work directly with scientists from the Hydrologic Remote Sensing Branch and the Pacific Coastal and Marine Science Center, who helped develop the camera systems and analytical workflows.
These camera systems provide a repeatable, cost‑effective, flexible platform for gathering high‑resolution data on inundation, riparian vegetation, stream temperature, and other river conditions in places that are difficult to study or where change is happening quickly.
In 2025-2026, the team acquired imagery for 140-160 kilometers of river corridor along the Molalla, Clackamas, North Santiam Rivers with additional flights planned for late summer 2026. Given the drought conditions of 2026, these flights will capture some of the lowest stream flows seen in the Willamette Basin.
Airborne camera pod and enclosed cameras:
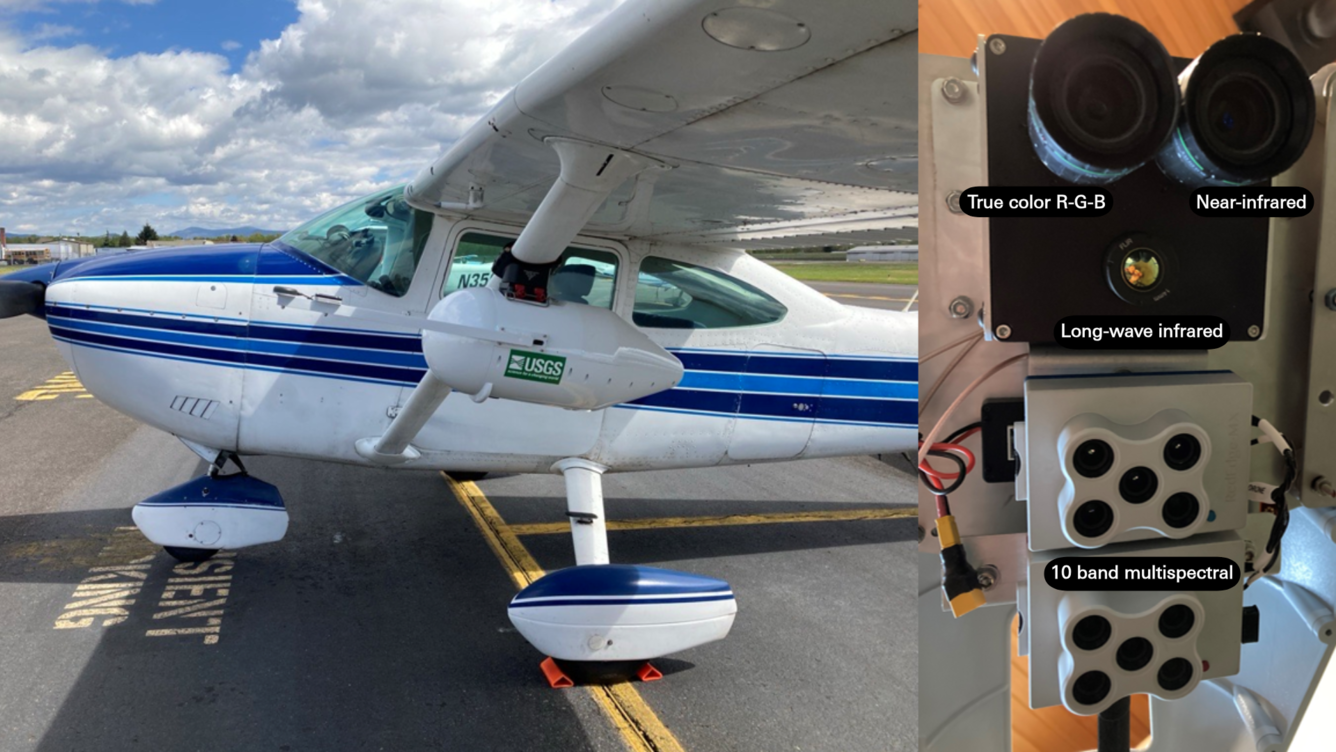
A small aircraft with a specialized wing camera pod for remote sensing flights. The system includes a true color (RGB) camera for standard visual mapping, a near-infrared (NIR) camera for vegetation analysis, a long-wave Infrared (LWIR) camera for thermal detection, and two stacked dual multispectral sensors capable of capturing 10 distinct spectral bands from blue to NIR.
Mobile river mapping platforms:
Mapping rivers across the geography of the Willamette Basin requires a fleet of whitewater-capable platforms. Sonar and imagery from rafts, kayaks, and autonomous platforms complement long-term continuous monitoring at USGS gaging stations.
River mapping with an uncrewed surface vehicle:
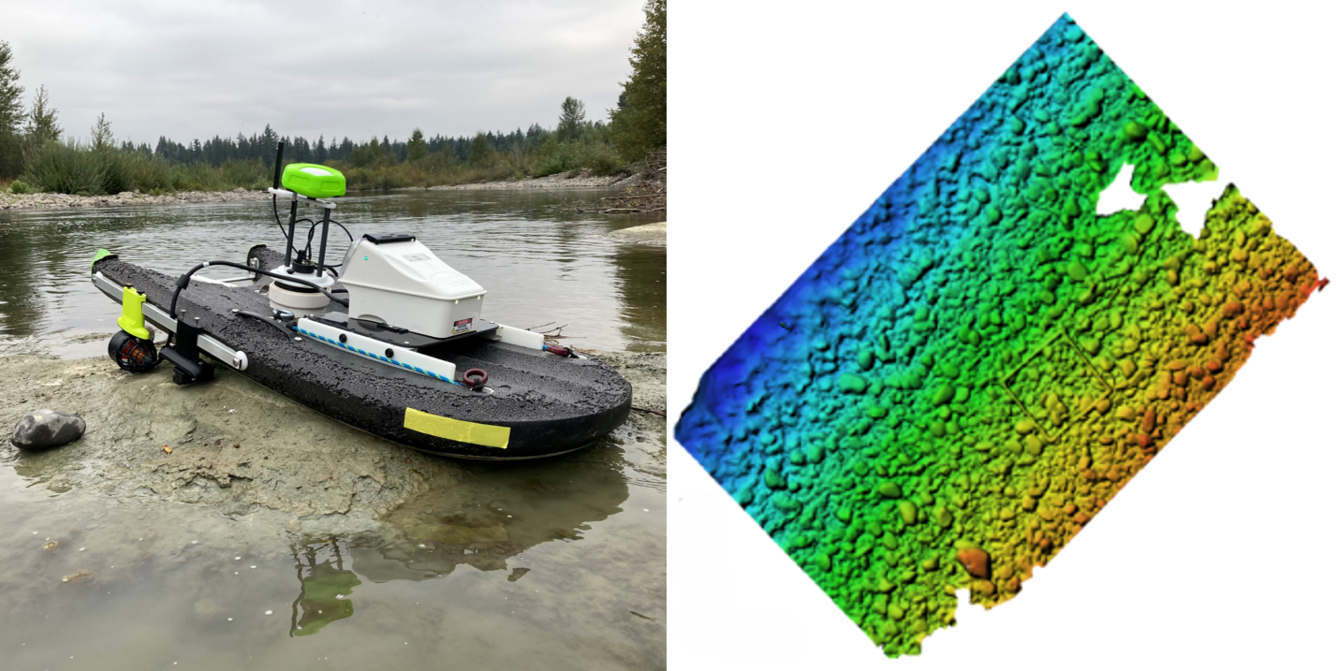
Left: a remotely controlled Uncrewed Surface Vehicle (USV) in a shallow river environment, outfitted with an Acoustic Doppler Current Profiler (ADCP) and a multi-camera array to map bathymetry and channel bed morphology. Right: The resulting high-resolution 3D map illustrates riverbed elevation using underwater imagery captured by the USV. The color gradient represents relative changes in elevation, transitioning from blue (deeper water or lower terrain) to red (shallower water).
Mobile mapping from orbit uses multispectral satellite images to produce accurate estimates of river depth, which are calibrated using depth measurements collected during field visits to USGS gaging stations.
Outcomes:
- Developing detailed continuous river corridor observations.
- Creating transferable workflows for broader application in other U.S. river basins.
- Advancing efficient, cost-effective methods for river mapping.
This work supports the USGS Next Generation Water Observing System (NGWOS) and Integrated Water Availability Assessments (IWAAs) Programs. This work is coordinated through the Oregon Water Science Center’s Integrated River Mapping Program (IRMP).
Related science project or program web pages.

Integrated Water Science Basins: Willamette River
Willamette River Basin thermalscapes: Visualizing stream temperatures in western Oregon

Integrated Water Science (IWS) Basins
A USGS geospatial data collection initiative in Oregon’s Willamette River Basin uses advanced remote sensing and on‑the‑ground measurements to map major rivers draining the Cascade Range. This work helps track how changing water resources and river channel conditions affect a wide array of water‑management needs, river hazards, recreational users, and habitat for ESA-listed spring Chinook salmon, winter steelhead and other native fish.
Topobathy LiDAR
Modular Airborne Camera Pod
Thermal Infrared Imagery
Mobile Monitoring Platforms
Overview
A major geospatial data collection and analysis initiative is in progress across Oregon’s Willamette Basin. This effort combines advanced remote sensing technologies and ground observations to generate spatially continuous data of river attributes. Mapping water depth, channel morphology, and stream temperature is useful for characterizing current conditions and tracking changes over time.
River channels are always changing - often slowly, and sometimes in sudden and noticeable ways. Seasonal flows, storms, shifting land, human activities and more reshape the channels and underwater features that make up a river. Tracking these changes in a cost‑ and time‑efficient way is important for understanding how they might affect river hazards, water availability, dam operations, drinking‑water facilities, fish habitats and other water‑management needs.
This information helps protect people, property, infrastructure and supports salmon recovery efforts. High‑resolution mapping can identify hazards like rapidly shifting gravel bars, logjams, bank erosion, and shallow navigation routes that can endanger boaters, complicate rescue operations, or damage bridges and water‑intake structures. These data also improve planning for floods, droughts, and debris flows - events that can disrupt drinking‑water supplies, hydropower facilities, and recreation access. High-resolution mapping is useful for quantifying habitat availability, tracking habitat changes, prioritizing river restoration, and other salmon recovery efforts.
Key objectives:
- Characterize river conditions across a diverse range of environments, from lowland river valleys to steep mountain streams.
- Inform water resources and fisheries management decisions by 1) providing high-resolution datasets that can support near-term planning and 2) creating mapping tools that enable affordable, efficient data collection in the future.
Methods and technologies:
Technology we’re using and developing to integrate geospatial data collected from boats, aircraft, and satellites and other platforms.
Topobathymetric lidar :
In partnership with the USGS 3D Elevation Program and U.S. Army Corps of Engineers, we’ve collected lidar on over ~600 kilometers of river corridors (2023–2025). Combined this with previous collections, now most major river corridors in the Willamette River Basin have topobathymetric lidar to support an array of hazard and habitat analyses.
Topobathymetric lidar of river corridors, integrated with land‑surface elevation data, is an important contribution to modeling the Nation in 3D. Integrated River mapping provides wide‑ranging benefits for both society and wildlife. Detailed mapping of riverbeds and banks enhances flood‑inundation modeling, bridge engineering, and drinking‑water protection. This work also supports ecosystem restoration, recreation planning, and water‑quality management.
3D National Topography Model | U.S. Geological Survey
Clackamas River point cloud captured during a lidar survey from a whitewater cataraft:
Thermal infrared imagery:
In 2024, we captured thermal infrared imagery from a helicopter over roughly 170 kilometers of unregulated streams to assess stream temperature in critical habitats.
Water temperature is one of the most important environmental factors for determining survival of fish species. Water temperature plays a major role in fish survival throughout their life cycle, and thermal imagery helps reveal where colder groundwater enters the river and where fish may find cooler refuge during warm periods.
Thermal infrared imagery of the Little North Santiam and North Santiam Rivers:
Thermal infrared (TIR) imagery from the 2024 Santiam River Basin survey, captured during helicopter‑based mapping. These data show surface water temperature patterns along the river, with darker colors indicating colder water. In this view, the Little North Santiam (lighter purple, warmer) is joining the North Santiam River (dark purple, colder).
Modular airborne camera pod:
We developed a modular airborne camera pod that can be mounted on a small aircraft. The pod has multispectral, thermal, and high‑resolution red-green-blue cameras. Remote‑sensing flights allow us to test these camera systems and collect imagery to map water depth, temperature, and velocity using both proven and emerging processing methods.
ORWSC staff work directly with scientists from the Hydrologic Remote Sensing Branch and the Pacific Coastal and Marine Science Center, who helped develop the camera systems and analytical workflows.
These camera systems provide a repeatable, cost‑effective, flexible platform for gathering high‑resolution data on inundation, riparian vegetation, stream temperature, and other river conditions in places that are difficult to study or where change is happening quickly.
In 2025-2026, the team acquired imagery for 140-160 kilometers of river corridor along the Molalla, Clackamas, North Santiam Rivers with additional flights planned for late summer 2026. Given the drought conditions of 2026, these flights will capture some of the lowest stream flows seen in the Willamette Basin.
Airborne camera pod and enclosed cameras:
A small aircraft with a specialized wing camera pod for remote sensing flights. The system includes a true color (RGB) camera for standard visual mapping, a near-infrared (NIR) camera for vegetation analysis, a long-wave Infrared (LWIR) camera for thermal detection, and two stacked dual multispectral sensors capable of capturing 10 distinct spectral bands from blue to NIR.
Mobile river mapping platforms:
Mapping rivers across the geography of the Willamette Basin requires a fleet of whitewater-capable platforms. Sonar and imagery from rafts, kayaks, and autonomous platforms complement long-term continuous monitoring at USGS gaging stations.
River mapping with an uncrewed surface vehicle:
Left: a remotely controlled Uncrewed Surface Vehicle (USV) in a shallow river environment, outfitted with an Acoustic Doppler Current Profiler (ADCP) and a multi-camera array to map bathymetry and channel bed morphology. Right: The resulting high-resolution 3D map illustrates riverbed elevation using underwater imagery captured by the USV. The color gradient represents relative changes in elevation, transitioning from blue (deeper water or lower terrain) to red (shallower water).
Mobile mapping from orbit uses multispectral satellite images to produce accurate estimates of river depth, which are calibrated using depth measurements collected during field visits to USGS gaging stations.
Outcomes:
- Developing detailed continuous river corridor observations.
- Creating transferable workflows for broader application in other U.S. river basins.
- Advancing efficient, cost-effective methods for river mapping.
This work supports the USGS Next Generation Water Observing System (NGWOS) and Integrated Water Availability Assessments (IWAAs) Programs. This work is coordinated through the Oregon Water Science Center’s Integrated River Mapping Program (IRMP).
Related science project or program web pages.
Integrated Water Science Basins: Willamette River
Willamette River Basin thermalscapes: Visualizing stream temperatures in western Oregon