
Local Tsunamis in the Pacific Northwest
In the past century, several damaging tsunamis have struck the Pacific Northwest coast (Northern California, Oregon, and Washington). All of these tsunamis were distant tsunamis generated from earthquakes located far across the Pacific basin and are distinguished from tsunamis generated by earthquakes near the coast—termed local tsunamis.

The Pacific Northwest is the site of the Cascadia subduction zone, where an oceanic tectonic plate (the Juan de Fuca plate) is being pulled and driven (i.e., subducted) beneath a continental plate (the North American plate). Earthquakes along the fault that is the contact between the two plates, termed the interplate thrust or megathrust, may generate significant local tsunamis in the Pacific Northwest.
Except for the M=7.2 1992 Cape Mendocino earthquake at the southernmost part of the subduction zone, there have been no major earthquakes on the megathrust in historic time. Does this mean that the two plates are sliding past each other freely without generating earthquakes? This would make the Cascadia subduction zone unlike most other subduction zones around the world. Rather, geologic evidence is accumulating that the Cascadia subduction zone is poised between major earthquakes. Therefore, the possibility exists that local tsunamis may someday accompany a major earthquake along the Cascadia megathrust. Some Native American tribal nations in the Pacific Northwest have legends of large waves striking the coast. Do these legends refer to tsunamis?
How do various parameters that describe an earthquake influence the resulting local tsunami? Such USGS research progressed in three phases.

Phase 1: Earthquake Source Parameters and Potential Local Tsunamis in Cascadia - Effect on local tsunamis from source parameters describing uniform rupture
Phase 2: A Stochastic Model for Potential Tsunamis in the Pacific Northwest - Effect on local tsunamis from spatial variations of slip during rupture
Phase 3: Local Tsunami Hazards in the Pacific Northwest from Cascadia Subduction Zone Earthquakes (USGS Professional Paper 1661-B)
#1. Earthquake Source Parameters and Potential Local Tsunamis in Cascadia
Effect on local tsunamis from source parameters describing uniform rupture
Overview
The relationship between the parameters that define earthquake rupture and local tsunamis is complex. For distant tsunamis that have traveled far from the origin of the earthquake, the magnitude of the earthquake is a good measure of the size of the tsunami. For local tsunamis, however, more knowledge than the magnitude is needed to calculate the eventual runup of the tsunami. This study was designed to calculate how local tsunamis are affected by variations in earthquake source parameters specific to faulting along the Cascadia subduction zone.
What Aspects of Earthquake Rupture Affect Tsunamis?
The nature of earthquake rupture is defined by many different parameters that can vary spatially and with time. Here we show how the following parameters affect local tsunamis:
Amount of Average Slip

During an earthquake, one side of the fault moves vertically and/or horizontally with respect to the other side. The distance the two sides move averaged over the rupture area is what we will call average slip. The relationship between fault slip and the permanent offset of the seafloor after earthquake rupture is linear. That is, if average slip for one earthquake (EQ 1) is twice that for another earthquake (EQ 2), the seafloor offset and the initial tsunami will be different also by a factor of two. Owing to propagation effects, however, there is a greater than linear relationship between the amplitude of the tsunami near shore and the amount of average slip. Therefore, the difference in the near-shore amplitude of the tsunamis generated by EQ 1 and EQ 2, for example, will be slightly greater than a factor of two.
The amount of slip throughout the rupture area of an earthquake has the largest influence on the size of the local tsunami. Is the average amount of slip related to the magnitude of the earthquake? Generally, slip increases with the magnitude of the earthquake. However, because other parameters such as the rupture area and physical properties of the rocks surrounding the rupture determine the magnitude of an earthquake, we cannot calculate the amount of slip associated with an earthquake without knowing these other parameters. For example, shown below is the average slip associated with many subduction zone earthquakes around the world. Although slip generally increases with magnitude, there is significant scatter in the data.
In this figure, a distinction is made between tsunami earthquakes and non-tsunami earthquakes. The term tsunami earthquakes is used to designate those earthquakes that generate larger than expected tsunamis relative to the magnitude of the earthquake. The average slip during rupture of a tsunami earthquake appears to be larger than a non-tsunami earthquake of the same magnitude.
Depth of Rupture

The size of the local tsunami also depends on how deep the earthquake ruptured within the earth. Shallow rupture will result in larger offset of the seafloor and hence, a larger initial tsunami, than a deep rupture earthquake. An example is shown below. The left part of the figure shows the portion of a fault that ruptures in green. The local tsunami that is generated from this rupture is shown below as a synthetic marigram (wave amplitude as a function of time). Fault C, shown in the second set of figures, ruptures much shallower in the earth and generates a substantially larger tsunami.
Orientation of Slip Vector

The figures above show a type of faulting known as thrust faulting, in which the overlying block moves upward and over the underlying block. Considered in 3 dimensions, however, the fault blocks could also move in-and-out of the page (screen) as shown by this perspective figure.
Oblique faulting such as this can occur in a subduction zone when the downgoing plate is moving at an oblique angle (θ) relative to the overriding plate. The obliquity of the slip vector (D) in the fault plane of dip (δ) is measured by the angle (λ) that the slip vector makes with a horizontal line in the fault plane.

The parameters used to create this image are merely for illustrating the effect of oblique rupture on tsunami propagation. Certainly, variations in the chosen parameters would affect the amplitude of the tsunami and the physical location of coastal inundation.
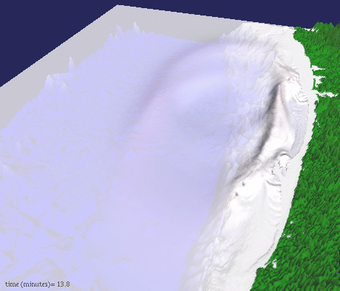
Why would such details of rupture be important in terms of generating local tsunamis? When oblique faulting as described occurs, the vertical offset of the seafloor is considerably different than for the case of simple thrust faulting. The result is the generation of secondary tsunamis that initially travel in a different direction than the deep-ocean and local tsunamis shown in the rupture diagrams above. Let's look at an animation of a tsunami generated from oblique faulting to better understand the different waves generated by this type of earthquake.
Peaks in the tsunami waves are shown by red intensity, whereas troughs are shown by blue intensity. For a tsunami generated by pure thrust faulting, only the primary wavefronts would be evident: one moving toward the deep ocean and one moving toward the local shoreline. As shown here, fault movement parallel to the convergence direction between the Juan de Fuca and North American plates results in the generation of secondary wavefronts. Most obvious is the isolated secondary wavefront propagating to the southeast. In addition, there is a secondary wavefront propagating to the northeast that is a continuation of the shoreward primary wavefront. Both of the secondary wavefronts initially travel parallel to shoreline, but their paths of travel curve (refract) toward shore. Thus, the length of shoreline inundation from this type of tsunami is significantly greater than inundation calculated from the primary wavefronts alone.
Future Work
These examples illustrate the complex relationship between the parameters that characterize earthquake rupture and the local tsunami that is generated. Presently, it is exceedingly difficult to devise likely scenarios of rupture along the Cascadia megathrust. Much work is presently under way by seismologists to determine the nature of earthquake rupture along major plate boundary faults. As more is learned about the nature of possible earthquakes in Cascadia, the hazards from local tsunamis can be better defined. See Phase 2 and Phase 3 (USGS Professional Paper 1661-B) of this research project.
Related Publications
Geist, E., and Yoshioka, S., 1996, Source parameters controlling the generation and propagation of potential local tsunamis along the Cascadia margin: Natural Hazards, v. 13 no. 2, pp. 151–177, doi: 10.1007/BF00138481.
Geist, E.L., 1996, Relationship between the present-day stress field and plate boundary forces in the Pacific Northwest: Geophysical Research Letters, v. 23 no. 23, pp. 3381–3384, doi: 10.1029/96GL03157.
Geist, E.L., 1998, Local Tsunamis and Earthquake Source Parameters: In: Dmowska, R., Saltzman, B. (Eds.), Advances in Geophysics. Tsunamigenic Earthquakes and Their Consequences 39, Elsevier, pp. 117–209, doi: 10.1016/S0065-2687(08)60276-9.
#2. A Stochastic Model for Potential Tsunamis in the Pacific Northwest
Effect on local tsunamis from spatial variations of slip during rupture
Beyond Scaling Relationships

In the first phase of research on potential tsunamis that may occur along the Pacific Northwest coast, we showed that the individual parameters of earthquake rupture (e.g., geometry of faulting, orientation of slip) have a significant effect on the local tsunami wavefield. For this reason, even though local tsunami runup generally increases with earthquake magnitude, there is substantial variation or scatter in this scaling relationship, as evidenced by average and maximum statistics of local observations.
Two observations are apparent in the figures shown here:
- for a given earthquake magnitude, local runup is substantially greater for tsunami earthquakes than for non-tsunami earthquakes;
- the degree of scatter is critical for estimating local tsunami hazards--comparison of earthquakes of similar magnitude (1944 Tonankai and 1986 Aleutian, for example) illustrates the discrepancy of maximum runup that could occur.
It is also important to note that these observations pertain to local tsunamis. There is considerably less scatter in the scaling relationship for distant tsunamis because of the smoothing effect of tsunami propagation on small-scale variations of the earthquake rupture process.
The observed scatter in the relationship between local runup and earthquake magnitude shown in the plot is caused by several different factors including water depth at the source, hypocentral depth, and rupture geometry (aspect ratio). In this study we focus on perhaps the largest source of this scatter: variation in the amount of slip throughout the rupture area.
Fundamental Effects on Slip Variations
We often think that during an earthquake, the fault slips a fixed amount. It serves not only as a common conception but also as a working assumption for many tsunami models (including models employed during the first phase of this study). An alternative and, perhaps, a more useful conception of earthquake rupture is that of a crack in which slip decreases to zero at the crack tip or at the edge of earthquake rupture. In Geist and Dmowska (1999) we demonstrate that incorporating "natural" slip variations into our tsunami generation model has a measurable effect on the local tsunami wavefield, in comparison to models that assume uniform slip throughout the rupture area. Moreover, we can use the slip distribution of an earthquake determined from global seismic observations to reconstruct the generated tsunami. Although reconstructing past tsunamis is a significantly worthwhile scientific endeavor for understanding the relationship between earthquakes and tsunamis (e.g., Geist and Zoback, 1999), an essential product of tsunami research is tsunami hazard assessments which we discuss next.
Forecasting Local Tsunami Hazards: A Collaborative Effort

The problem of forecasting tsunami hazards then is determining the range of tsunamis that can be produced by different combinations of source parameters. Even if all of the geometric parameters of a "scenario earthquake" are prescribed, there would be a large uncertainty in determining the ensuing tsunami because of the difficulty in formulating a "characteristic" slip distribution. While seemingly random, earthquake slip distributions can be thought of in terms of fractals. A source model can be developed to construct an infinite number of different slip distributions that statisfy common observations of earthquakes. These slip distributions then can be used to gauge the range the possible tsunamis from an earthquake of a particular magnitude and location. Two examples of stochastic slip distributions are shown here (warm colors represent high amounts of slip).

To determine the range of possible tsunami amplitudes for a given earthquake magnitude and location, a Monte Carlo-type simulation can be run, involving a large number of slip distributions. Statistics from the simulation could then be used for hazard planning. An example showing minimum, average, and maximum nearshore tsunami amplitude (not runup) for a section of the Pacific Northwest coastline is shown below. The horizontal gridpoint axis is distance measured parallel to the shoreline (approx. 3.5 km/gridpoint).
It is important to note that the technique described above only accounts for nearshore tsunami amplitude variations caused by different slip distributions. A complete hazard analysis would include variations in other source parameters, the effects of which are discussed in the first phase of our study of potential Pacific Northwest tsunamis.
The stochastic/Monte Carlo method provides the groundwork for an alternative way of forecasting local tsunami hazards. The third phase of our study focuses on forecasting tsunami hazards that also includes the probability of earthquake occurrence that would most likely involve methods similar to those used to formulate probabilistic estimates of ground shaking from earthquakes (see the USGS National Seismic Hazard Maps). Developing tsunami hazards maps in future will rely on the broad collaboration among the many scientific disciplines that are involved in tsunami research.
Related Publications
Geist, E. L., 1999, A stochastic source model for estimating local tsunami hazards: Seismological Research Letters, v. 70 no. 2, p. 221, doi: 10.1785/gssrl.70.2.190.
Geist, E.L., and Dmowska, R., 1999, Local Tsunamis and Distributed Slip at the Source: Pure and Applied Geophysics, v. 154 no. 3-4, pp. 485–512, doi: 10.1007/s000240050241.
3. Local Tsunami Hazards in the Pacific Northwest from Cascadia Subduction Zone Earthquakes
Please see: USGS Professional Paper 1661-B, Geist, E. L., 2005