
Floods and the South Atlantic Water Science Center
Floods and the South Atlantic Water Science Center
We present USGS tools, websites, publications, and other resources for monitoring, studying, and communicating flood information.
Georgia, North Carolina and South Carolina flood related information.
Flooding Resources
Georgia, North Carolina, and South Carolina flood topics.
Georgia:
- Map: USGS High flow and NWS flood status
- Map and Data Table (Gage Height): Current Condition Estimate
- Epic Sept. 2009 flood information
- 1977 Toccoa flood
North Carolina:
- Map: USGS High flow and NWS flood status
- Map and Data Table (Gage Height): Current Condition Estimate
- Tar River Basin Flood-Inundation Mapping
South Carolina:
- Map: USGS High flow and NWS flood status
- Map and Data Table (Gage Height): Current Condition Estimate
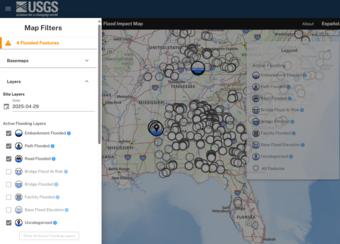
USGS Real-Time Flood Impact Map
The USGS Real-Time Flood Impact (RT-FI) Map displays the locations (called “Flood Impact Locations”) where the USGS has measured the height of critical safety or infrastructure features that may be vulnerable to flood impacts. Some examples of Flood Impact Locations include stream and river embankments; roads and bridges; pedestrian paths; buildings; and more.
Flood Impact Locations are surveyed and associated with a nearby USGS real-time streamgage. When the streamgage water level (or gage height) exceeds the Flood Impact Location’s surveyed height, its icon will display on the map, showing that this location may be currently flooded. When you click on the icon, the pop-up will display the current gage height and the Flood Impact Location height, so you can compare how close that location is to the current water level. Some Flood Impact Locations may be measured below the level of actual flooding to provide an early warning that flooding may be imminent.
A Spanish translation of the front-end RT-FI Map interface is also available by clicking on "Español" in the upper right corner of the Map.
*Disclaimer: English is the official language and authoritative version of all federal information.
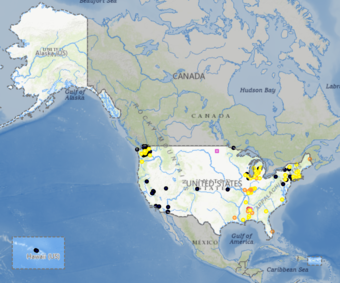
USGS National Water Dashboard Map
Streamflow: High Flow and Surface-Water Levels: Flooding

USGS Flood Inundation Mapping Program
The USGS Flood Inundation Mapping Program (FIM) partners with local communities and other government agencies to develop and validate flood inundation map libraries. Click the title above to visit the USGS FIM website and learn more about available tools. Completed projects are collected on the USGS National Flood Inundation Mapper, brought to you by the USGS Wisconsin Internet Mapping Group (WiM). Click the image on the right to go straight to the Mapper.
The USGS operates an event-based mobile storm-surge sensor network to capture information about coastal and inland storm tides. Click the title above to learn more about the USGS Short-Term Network, or click the image on the right to go straight to the USGS Flood Event Viewer.
Water Data for the Nation (WDFN) is the new USGS water data portal where you can find a wealth of historic and real-time data and historical data.
USGS National Water Information System (NWIS) Peak Streamflow Data
NWIS is a legacy USGS data portal which is being replaced by Water Data for the Nation (WDFN). Click the image at the right or the title above to go to the NWIS website where you can query for peak streamflow data by station, state, or region.
► NWIS Peak Streamflow Data Tables: Georgia | North Carolina | South Carolina
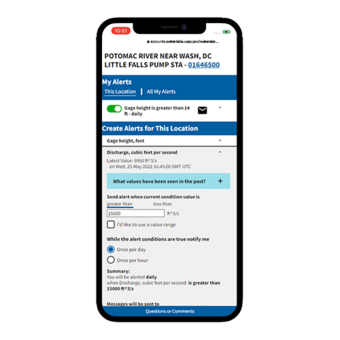
Get notifications for changes in water conditions based on thresholds you choose.
Real-time data from USGS monitoring locations are transmitted via satellite or other telemetry to USGS offices at various intervals, in most cases, once every hour. Emergency transmissions, such as during floods, may be more frequent. Notifications will be based on the data received at these site-dependent intervals.
Poster: 100-Year Flood--It's All About Chance
How can a 100-year flood strike twice in 15 years? This is a downloadable poster discussing the meaning and use of probability language in flood characterization.

The USGS StreamStats website is a GIS-based web tool for estimating streamflows at gaged and ungaged locations. Features similar to the NSS program are presented to users with no programs to install. Users can visit the StreamStats website linked here and click on a stream location on the interactive map to compute estimated streamflows for floods and other statistics. Additional statistics at gaged locations are also presented.
Created: June 6, 2017
Georgia, North Carolina and South Carolina flood related information.
Flooding Resources
Georgia, North Carolina, and South Carolina flood topics.
Georgia:
- Map: USGS High flow and NWS flood status
- Map and Data Table (Gage Height): Current Condition Estimate
- Epic Sept. 2009 flood information
- 1977 Toccoa flood
North Carolina:
- Map: USGS High flow and NWS flood status
- Map and Data Table (Gage Height): Current Condition Estimate
- Tar River Basin Flood-Inundation Mapping
South Carolina:
- Map: USGS High flow and NWS flood status
- Map and Data Table (Gage Height): Current Condition Estimate
USGS Real-Time Flood Impact Map
The USGS Real-Time Flood Impact (RT-FI) Map displays the locations (called “Flood Impact Locations”) where the USGS has measured the height of critical safety or infrastructure features that may be vulnerable to flood impacts. Some examples of Flood Impact Locations include stream and river embankments; roads and bridges; pedestrian paths; buildings; and more.
Flood Impact Locations are surveyed and associated with a nearby USGS real-time streamgage. When the streamgage water level (or gage height) exceeds the Flood Impact Location’s surveyed height, its icon will display on the map, showing that this location may be currently flooded. When you click on the icon, the pop-up will display the current gage height and the Flood Impact Location height, so you can compare how close that location is to the current water level. Some Flood Impact Locations may be measured below the level of actual flooding to provide an early warning that flooding may be imminent.
A Spanish translation of the front-end RT-FI Map interface is also available by clicking on "Español" in the upper right corner of the Map.
*Disclaimer: English is the official language and authoritative version of all federal information.
USGS National Water Dashboard Map
Streamflow: High Flow and Surface-Water Levels: Flooding
USGS Flood Inundation Mapping Program
The USGS Flood Inundation Mapping Program (FIM) partners with local communities and other government agencies to develop and validate flood inundation map libraries. Click the title above to visit the USGS FIM website and learn more about available tools. Completed projects are collected on the USGS National Flood Inundation Mapper, brought to you by the USGS Wisconsin Internet Mapping Group (WiM). Click the image on the right to go straight to the Mapper.
The USGS operates an event-based mobile storm-surge sensor network to capture information about coastal and inland storm tides. Click the title above to learn more about the USGS Short-Term Network, or click the image on the right to go straight to the USGS Flood Event Viewer.
Water Data for the Nation (WDFN) is the new USGS water data portal where you can find a wealth of historic and real-time data and historical data.
USGS National Water Information System (NWIS) Peak Streamflow Data
NWIS is a legacy USGS data portal which is being replaced by Water Data for the Nation (WDFN). Click the image at the right or the title above to go to the NWIS website where you can query for peak streamflow data by station, state, or region.
► NWIS Peak Streamflow Data Tables: Georgia | North Carolina | South Carolina
Get notifications for changes in water conditions based on thresholds you choose.
Real-time data from USGS monitoring locations are transmitted via satellite or other telemetry to USGS offices at various intervals, in most cases, once every hour. Emergency transmissions, such as during floods, may be more frequent. Notifications will be based on the data received at these site-dependent intervals.
Poster: 100-Year Flood--It's All About Chance
How can a 100-year flood strike twice in 15 years? This is a downloadable poster discussing the meaning and use of probability language in flood characterization.
The USGS StreamStats website is a GIS-based web tool for estimating streamflows at gaged and ungaged locations. Features similar to the NSS program are presented to users with no programs to install. Users can visit the StreamStats website linked here and click on a stream location on the interactive map to compute estimated streamflows for floods and other statistics. Additional statistics at gaged locations are also presented.
Created: June 6, 2017