
Population-level modeling of bigheaded carps in the Upper Mississippi River
Bighead carp and silver carp (collectively known as bigheaded carps) first escaped to the Mississippi River Basin in the 1970s and have since invaded the Upper Mississippi River. The species threaten the economies and ecosystems for the Upper Mississippi River. USGS scientists are developing population-level models to help guide and inform control strategies and evaluate ongoing management actions with collaborators from Auburn University.
Bigheaded carps population-level modeling projects
Resource managers seek to limit the spread of bigheaded carps in the Upper Mississippi River Basin. Population-level models can provide insight into different control strategies. For the Upper Mississippi River, these models are being used to compare different behavioral deterrent approaches (such as the lock and dam locations where deterrents might be placed) and physical removal approaches (such as harvest locations and levels).

Figure 2 from Erickson et al. (2024) Life cycle diagram and census points for preproduction census of silver carp Hypophthalmichthys molitrix. The diagram is a visualization of the Metapopulation Integral Projection Model kernel. Individuals undergo growth, survival, and reproduction between every census. At census time, individuals also may immigrate to or emigrate from the populations. Image courtesy of Dan O’Keefe, Michigan Sea Grant (CC BY-NC-ND 2.0). Figure originally presented in Coles et al. (2023).
USGS scientists, with collaborators from state resource agencies, federal partners, and universities, develop, parameterize, and apply population-level models. This suite of models estimates demographic rates for the species, estimate movement rates, compare control strategies, and evaluate control efforts. The models include R and Python programming packages and code to run the models.
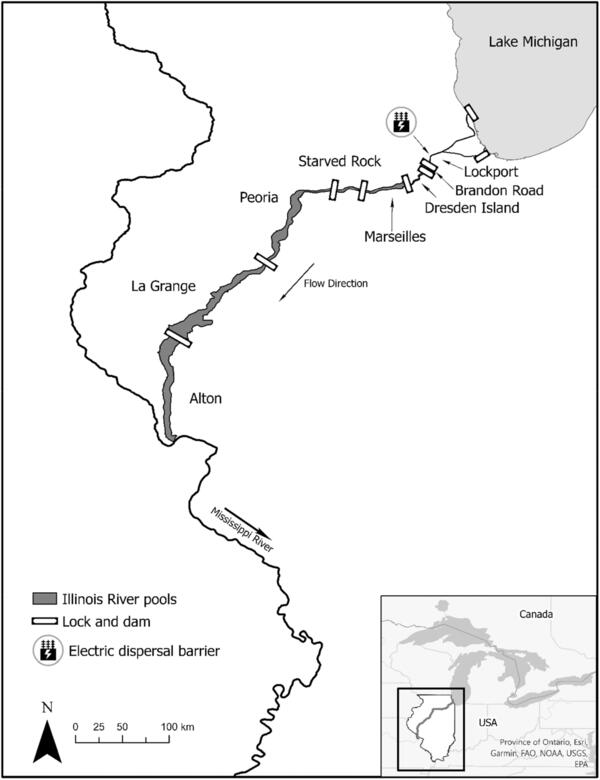
Figure from Kallis et al. (2023): Pools of the Illinois River (Alton through Dresden Island pools) within which bigheaded carp population dynamics were modelled. Brandon and Lockport pools are included for refence.
As an example, the Spatially Explicit Invasive Carp (SEICarp) population model was created to compare control strategies in the Illinois River. The model demonstrates the importance of targeting not only the invasion front, near the Great Lakes, but also the recruitment population farther from the invasion front. USGS scientists also expanded and generalized SEICarp to become the Metapopulation Integral Projection Model (MetaIPM) to allow the model to be used with more species and aquatic systems.

Figure 3 from Kallis et al. (2023). Proportional change in the abundance of bigheaded carp in Dresden Island Pool (i.e. invasion front) of the Illinois River after 25-year simulations of varying harvest scenarios. Proportional change is relative to the reference scenario (i.e. zero harvest mortality, baseline movement rates). A harvest of 1 represents 100% of fish being removed annually and a harvest of 0 indicates no harvest. A proportional change of zero indicates that a scenario had the same effect as the no-harvest reference scenario (red line), and the blue line indicates a 90% decrease in the population size relative to the no-harvest reference scenario (target reduction levels). Outliers are not displayed.
Within the Illinois River, USGS scientist have conducted additional analysis to better understand and improve population modeling. These results help managers understand the importance of different model parameter inputs and inform management actions and data needs.

Figure 4 from Erickson et al. (2024): Pool-specific population-level sensitivities for sigmoidal maximum harvest rate in population model (as a function of length) to silver carp Hypophthalmichthys molitrix populations in each pool from the 2024 sensitivity analysis. The y-axis is the pool with harvest, and the columns are populations for which sensitivities are calculated. For example, the uppermost and rightmost bar is the sensitivity of the silver carp population in Dresden Island Pool to harvest in Starved Rock Pool in the last simulation year, year 40. (a) Local sensitivity analysis sensitivities. (b) Global sensitivity analysis with Morris method sensitivities. (c) Global sensitivity analysis with Sobol’ method sensitivities.
USGS scientists have developed new metapopulation models to better understand bigheaded carps in the Illinois River. The models provide insight into how population source and sink dynamics affect carp control tools. For example, these models have allowed for the comparison of different behavioral deterrent placements in the Illinois River.

Figure 4 from Schoolmaster et al. (2024) Percent change in river-scale (metapopulation) per capita growth rate given a deterrent barrier that reduces the movement probability indicated by the plot label 50%. Results are shown for bighead carp (solid line) and silver carp (dashed line). The grey areas are the 95% confidence intervals estimated by resampling. The plot labels present the movement probability that was modified by the deterrent barrier. For example, the plot labeled ϕ2,1 shows the results of reducing the movement probability from Marseilles (pool 2) to Dresden Island (pool 1) by 50%.
Bighead carp and silver carp (collectively known as bigheaded carps) first escaped to the Mississippi River Basin in the 1970s and have since invaded the Upper Mississippi River. The species threaten the economies and ecosystems for the Upper Mississippi River. USGS scientists are developing population-level models to help guide and inform control strategies and evaluate ongoing management actions with collaborators from Auburn University.
Bigheaded carps population-level modeling projects
Resource managers seek to limit the spread of bigheaded carps in the Upper Mississippi River Basin. Population-level models can provide insight into different control strategies. For the Upper Mississippi River, these models are being used to compare different behavioral deterrent approaches (such as the lock and dam locations where deterrents might be placed) and physical removal approaches (such as harvest locations and levels).
Figure 2 from Erickson et al. (2024) Life cycle diagram and census points for preproduction census of silver carp Hypophthalmichthys molitrix. The diagram is a visualization of the Metapopulation Integral Projection Model kernel. Individuals undergo growth, survival, and reproduction between every census. At census time, individuals also may immigrate to or emigrate from the populations. Image courtesy of Dan O’Keefe, Michigan Sea Grant (CC BY-NC-ND 2.0). Figure originally presented in Coles et al. (2023).
USGS scientists, with collaborators from state resource agencies, federal partners, and universities, develop, parameterize, and apply population-level models. This suite of models estimates demographic rates for the species, estimate movement rates, compare control strategies, and evaluate control efforts. The models include R and Python programming packages and code to run the models.
Figure from Kallis et al. (2023): Pools of the Illinois River (Alton through Dresden Island pools) within which bigheaded carp population dynamics were modelled. Brandon and Lockport pools are included for refence.
As an example, the Spatially Explicit Invasive Carp (SEICarp) population model was created to compare control strategies in the Illinois River. The model demonstrates the importance of targeting not only the invasion front, near the Great Lakes, but also the recruitment population farther from the invasion front. USGS scientists also expanded and generalized SEICarp to become the Metapopulation Integral Projection Model (MetaIPM) to allow the model to be used with more species and aquatic systems.
Figure 3 from Kallis et al. (2023). Proportional change in the abundance of bigheaded carp in Dresden Island Pool (i.e. invasion front) of the Illinois River after 25-year simulations of varying harvest scenarios. Proportional change is relative to the reference scenario (i.e. zero harvest mortality, baseline movement rates). A harvest of 1 represents 100% of fish being removed annually and a harvest of 0 indicates no harvest. A proportional change of zero indicates that a scenario had the same effect as the no-harvest reference scenario (red line), and the blue line indicates a 90% decrease in the population size relative to the no-harvest reference scenario (target reduction levels). Outliers are not displayed.
Within the Illinois River, USGS scientist have conducted additional analysis to better understand and improve population modeling. These results help managers understand the importance of different model parameter inputs and inform management actions and data needs.
Figure 4 from Erickson et al. (2024): Pool-specific population-level sensitivities for sigmoidal maximum harvest rate in population model (as a function of length) to silver carp Hypophthalmichthys molitrix populations in each pool from the 2024 sensitivity analysis. The y-axis is the pool with harvest, and the columns are populations for which sensitivities are calculated. For example, the uppermost and rightmost bar is the sensitivity of the silver carp population in Dresden Island Pool to harvest in Starved Rock Pool in the last simulation year, year 40. (a) Local sensitivity analysis sensitivities. (b) Global sensitivity analysis with Morris method sensitivities. (c) Global sensitivity analysis with Sobol’ method sensitivities.
USGS scientists have developed new metapopulation models to better understand bigheaded carps in the Illinois River. The models provide insight into how population source and sink dynamics affect carp control tools. For example, these models have allowed for the comparison of different behavioral deterrent placements in the Illinois River.
Figure 4 from Schoolmaster et al. (2024) Percent change in river-scale (metapopulation) per capita growth rate given a deterrent barrier that reduces the movement probability indicated by the plot label 50%. Results are shown for bighead carp (solid line) and silver carp (dashed line). The grey areas are the 95% confidence intervals estimated by resampling. The plot labels present the movement probability that was modified by the deterrent barrier. For example, the plot labeled ϕ2,1 shows the results of reducing the movement probability from Marseilles (pool 2) to Dresden Island (pool 1) by 50%.