
2023 Quarter 4 USGS Stream Discharge and National Snow and Ice Data Center Data
Spring flooding can be a concern across much of the upper Midwest. The USGS excels at measuring stream discharge, or the volume of water moving through a stream per unit of time, which helps us monitor flooding in real-time.
Predicting discharge in springtime is challenging and requires an understanding of a range of environmental drivers, including snowpack dynamics (e.g., magnitude, melt timing, and melt rate). Pairing USGS collected stream discharge data with other data streams can aid in understanding what drives springtime peak discharge and flooding.
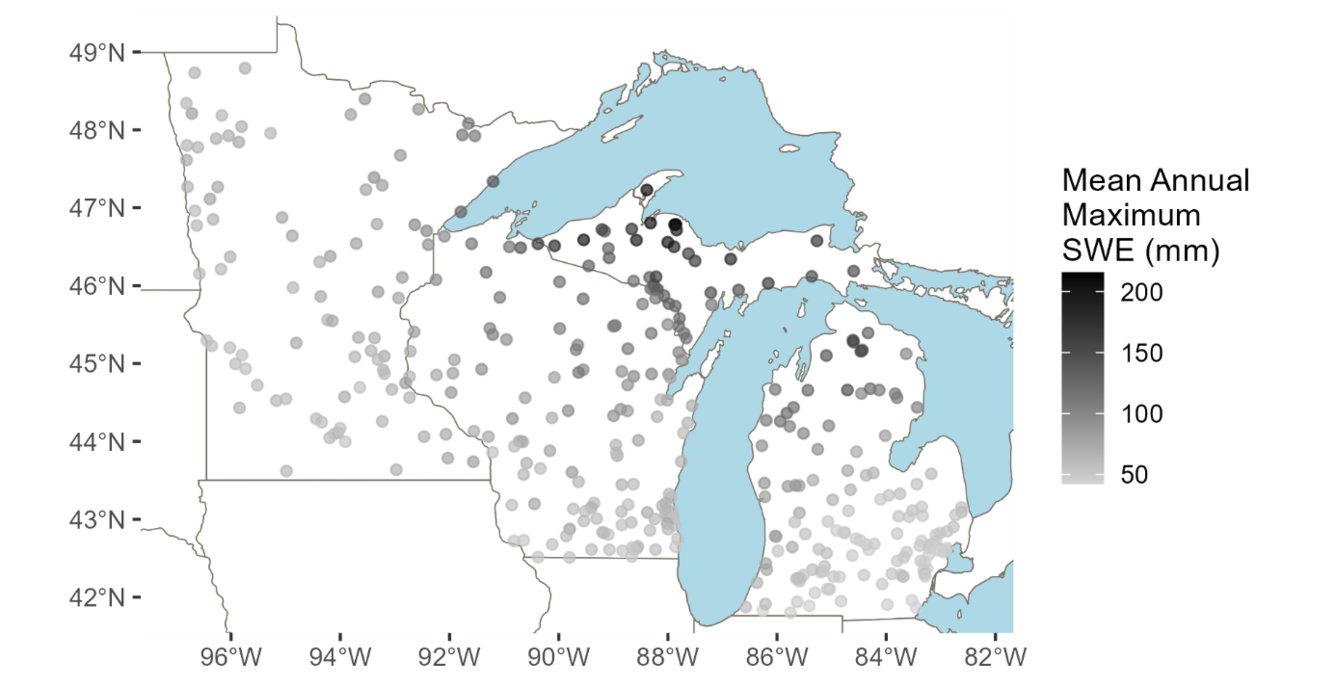
For this data highlight, we paired daily discharge and climate data from 387 GAGES-2 watersheds in the upper Midwest with at least 10 years of complete daily discharge. 87 of these gages are in Minnesota, 135 in Wisconsin, and 165 in Michigan (Figure 1). For this data highlight, we only look at data from 2000-2020, though 259 of these 387 gages go back to at least 1985. We report discharge in mm/day, which is an area-normalized flow rate that allows for easier comparison across watersheds of different sizes. We coupled this discharge data with watershed averaged Snow Water Equivalent (SWE), or the measure of how much liquid water is contained in snowpack, from the NASA National Snow and Ice Data Center.
It is typically expected that springtime peak discharge coincides with snowmelt. Figure 2 shows an example daily stream discharge and daily SWE for one water year for a USGS gage in northern Michigan, highlighting the expected close timing between half SWE (when SWE melts to half its peak) and peak spring discharge.

Even though there is an expected relationship between peak discharge and snowmelt, this data highlight shows that the magnitude of peak discharge does not dramatically increase with larger snowpack (Figure 3). This suggests that the magnitude of the snowpack may not be the primary driver of springtime peak discharge.

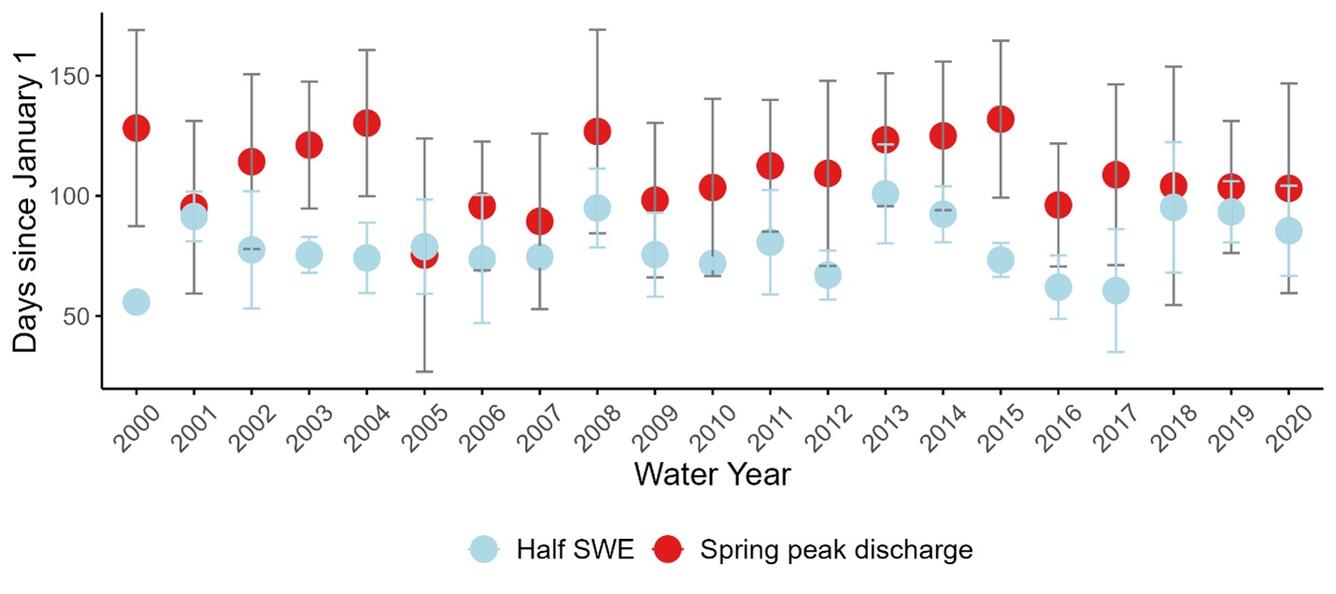
The timing of peak discharge in spring is variable year-to-year (red circles in Figure 4), with the average date of April 17 (107 days into the calendar year). In some years, the timing of snowpack reduction is highly coupled to maximum discharge (when red and blue circles plot close together) and in other years the timing is decoupled (when red and blue circles plot far from each other).
Clearly more work is needed to decipher the complex relationships between spring discharge and snowmelt magnitude, timing, and rate; coupling datasets from different agencies may be the key!
Acknowledgments:
We thank John Hammond for conducting the data pull.
Data sources:
U.S. Geological Survey. (2023). National water information system, USGS water data for the nation. Retrieved from http://nwis.waterdata.usgs.gov/nwis. Accessed August 17, 2023.
Falcone, J. A. (2011). GAGES-II: Geospatial attributes of gages for evaluating streamflow. US Geological Survey.
Broxton, P., X. Zeng, and N. Dawson. (2019). Daily 4 km Gridded SWE and Snow Depth from Assimilated In-Situ and Modeled Data over the Conterminous US, Version 1. Boulder, Colorado USA. NASA National Snow and Ice Data Center Distributed Active Archive Center. https://doi.org/10.5067/0GGPB220EX6A. Accessed August 17, 2023.
Wieczorek, M.E., Hafen, K.C., and Staub, L.E. (2023). Data-Driven Drought Prediction Project Model Inputs for Upper and Lower Colorado Portions of the National Hydrologic Geo-Spatial Fabric version 1.1 and Select U.S. Geological Survey Streamgage Basins: U.S. Geological Survey data release, https://doi.org/10.5066/P98IG8LO.