
Tribal Land Vegetation and Watershed Modeling
San Carlos Apache Reservation covers 1.8 million acres in east-central Arizona, and has diverse ecosystems and vegetation types that support a natural resource-based economy.
The USGS Western Geographic Science Center has been partnering with collaborators from the San Carlos Apache Tribe (SCAT) and Bureau of Indian Affairs (BIA) to address natural resource questions since 2004. We work with SCAT Departments of Forestry, Range Management and Environmental Protection.
Historically, we’ve developed a relationship with the Tribe, with land management questions, hypotheses, engagement and science to investigate how managers can impact vegetation, fire, and water quality and quantity. Much of the work we do is through the use of remote sensing. Satellites, like Landsat, are incredibly useful for monitoring change because they collect continuous information on a global scale. And with the Landsat series, have been collecting data for over 40 years, allowing us to make Earth observations presently and in the past that can help us to inform future problem solving tied to climate and management challenges.
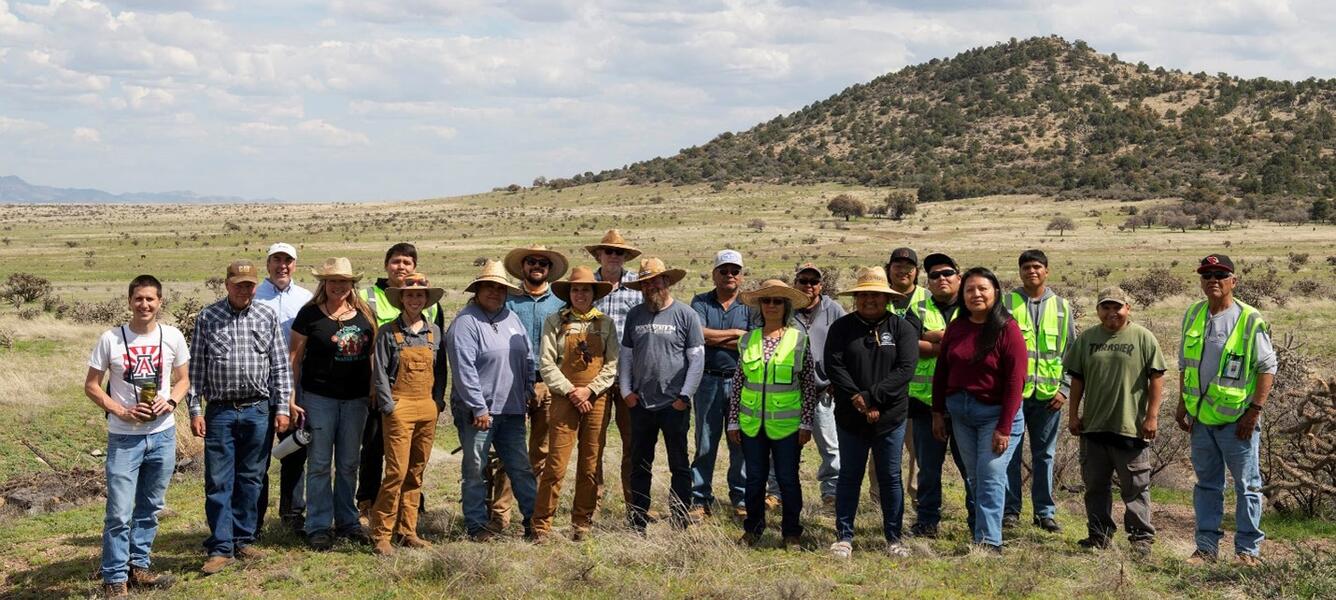
Photo of partners working together at the San Carlos Apache Reservation in Arizona.
This has resulted in rangeland condition maps, LIDAR density and biomass maps, burn severity maps, and forest and woodland biomass estimates. We also investigate research questions related to wildfire and forest fuel treatments focus on how restoring fire to the land impacts fire severity and overall forest health. Current projects include studying riparian vegetation response to climate, particularly the effects of drought and flooding in the upper Gila River watershed.
Fire Burn Severity
We used remotely sensed data from the Landsat 8 and WorldView-2 satellites to estimate vegetation burn severity of the Creek Fire on the San Carlos Apache Reservation, where wildfire occurrences affect the Tribe’s crucial livestock and logging industries. Accurate pre- and post-fire canopy maps at high (0.5-meter) resolution were created from WorldView-2 data to generate canopy loss maps, and multiple indices from pre- and post-fire Landsat 8 images were used to evaluate vegetation burn severity. Normalized difference vegetation index based vegetation burn severity map had the highest correlation coefficients with canopy loss map from WorldView-2. Two distinct approaches – canopy loss mapping from WorldView-2 and spectral index differencing from Landsat 8, agreed well with the field-based burn severity estimates and are both effective for vegetation burn severity mapping. Canopy loss maps created with WorldView-2 imagery add to a short list of accurate vegetation burn severity mapping techniques that can help guide effective management of forest resources on the San Carlos Apache Reservation, and the broader fire-prone regions of the Southwest.

Aboveground Biomass Estimates with LiDAR
Light Detection and Ranging (lidar) is an increasingly popular Earth observing data type. Lidar is an active remote sensing system that can measure the three-dimensional (3-D) structural characteristics of Earth features, which are not directly captured by passive optical land imaging systems. The U.S. Geological Survey (USGS) 3D Elevation Program (3DEP) was recently established to provide airborne lidar data coverage on a national scale. As part of a broader research effort of the USGS to develop an effective remote sensing-based methodology for the creation of an operational biomass Essential Climate Variable (Biomass ECV) data product, we evaluated the performance of airborne lidar data at various pulse densities against Landsat 8 satellite imagery in estimating above ground biomass for forests and woodlands in a study area in east-central Arizona, U.S. Airborne lidar and Landsat 8 derived metrics were used in linear regression analysis against field based biomass estimates. High point density airborne lidar data were randomly sampled to produce five lidar datasets with reduced densities ranging from 0.5 to 8 point(s)/m2, corresponding to the point density range of 3DEP to provide national lidar coverage over time. Lidar-derived aboveground biomass estimate errors showed an overall decreasing trend as lidar point density increased from 0.5 to 8 points/m2. Landsat 8-based aboveground biomass estimates produced errors larger than the lowest lidar point density of 0.5 point/m2, and therefore Landsat 8 observations alone were ineffective relative to airborne lidar for generating a Biomass ECV product, at least for the forest and woodland vegetation types of the Southwestern U.S. While a national Biomass ECV product with optimal accuracy could potentially be achieved with 3DEP data at 8 points/m2, our results indicate that even lower density lidar data could be sufficient to provide a national Biomass ECV product with accuracies significantly higher than that from Landsat observations alone.


Vegetation Response to Water Availability
A variety of vegetation indices derived from remotely sensed data have been used to assess vegetation conditions, enabling the identification of drought occurrences as well as the evaluation of drought impacts. Moderate Resolution Imaging Spectroradiometer (MODIS) Terra 8-day composite data were used to compute the Modified Soil Adjusted Vegetation Index II (MSAVI2) of four dominant vegetation types over a 13-year period (2002 – 2014) on the San Carlos Apache Reservation in Arizona, US. MSAVI2 anomalies were used to identify adverse impacts of drought on vegetation, characterized as mean MSAVI2 below the 13-year average. In terms of interannual variability, we found similar responses between grassland and shrubland, and between woodland and forest vegetation types. We compared MSAVI2 for specific vegetation types with precipitation data at the same time step, and found a lag time of roughly two months for the peak MSAVI2 values following precipitation in a given year. All vegetation types responded to summer monsoon rainfall, while shrubland and annual herbaceous vegetation also displayed a brief spring growing season following winter precipitation. MSAVI2 values of shrublands corresponded well with precipitation variability both for summer rainfall and winter snowfall, and can be potentially used as a drought indicator on the San Carlos Apache Reservation given its wide geographic distribution. We demonstrated that moderate temporal frequency satellite-based MSAVI2 can provide drought monitoring to inform land management decisions, especially on vegetated tribal land areas where in situ precipitation data are limited.

Riparian Response in the Upper Gila Watershed

FIGURE: A map showing the primary study site, including the San Carlos River and Bylas Reach of the Gila River from Petrakis et al. (2023).
The primary objective of this study was to measure direct relationships between vegetation conditions and climate drivers to help develop a framework to inform predictive management for these riparian forests, with supplemental funding from the Southwest CASC (Mapping Riparian Vegetation Response to Climate).
Products depict how vegetation extent, canopy cover, and composition in the Upper Gila River Watershed riparian zones have changed over time and provide information on the current conditions of the vegetation in response to climatic factors and river discharge. Using aerial and satellite imagery over an 84-year time frame, USGS scientists are working with resource managers from the San Carlos Apache Tribe to identify restoration and vegetation management actions that would provide value to stakeholders and local residents throughout the region
Significant findings from this work indicate that drought-stressed tamarisk contributed to high-severity wildfire, burned bridges, and combustible infrastructure during the 2021 Bottom Fire. Researchers found that tamarisk grows faster and stronger after disturbances like wildfire and exhibits greater drought stress than native species. As part of this project, USGS worked with SCAT to help lead a training to monitor the tamarisk beetle, on-the-ground, in real time as it works its way onto the Reservation from the north and east.
Natural Infrastructure in Dryland Streams (NIDS) including rock detention structures, beaver dams and their analogs, and check dams have been shown to be an effective restoration strategy used by the Tribe and others for increasing water availability, regulating flows, and reducing flood and erosion risks (Norman et al. 2022).


PHOTOS: Community members of the SCAT collecting tamarisk beetles on the Reservation (photo by Roy Petrakis, USGS) and USGS scientists teaching at the San Carlos Apache Tribe Summer Youth Practicum for Environmental Protection where the kids were talking about, learning about, and building NIDS (photo by Christy Sangster Begay, SCAT).
Future research questions include how tamarisk leaf beetle defoliation affects fire risk, how watershed conditions are impacted by forest and range treatments, and additional inquiries related to watershed health and flood risk.
Video
For an overview of some of the work we have completed, check this webinar let by partners at the San Carlos Apache Tribe
Southwest & South Central CASC Tribal Climate Resilience Webinar 08 05 25
Goseyun, T., Lister, N., and Richens, C., 2024, Juniper Tank Pasture Rehabilitation, part of the USGS hosted, Human-Built Natural Infrastructure in Dryland Streams — Lessons from the "20-Year Crew" session at the National Conference on Ecosystem Restoration, in Albuquerque, NM, https://youtu.be/1O_rCzhpIwk?si=HePX7sRfeycTpFP4
PUBLICATIONS:
Middleton, B., & Norman, L. (2021). Remote Sensing Analysis to Quantify Change in Woodland Canopy Cover on the San Carlos Apache Reservation, Arizona, USA (1935 vs. 2017). Land, 10(4), 393. https://doi.org/10.3390/land10040393
Middleton, B. R., Wilson, N. R., & Norman, L. M. (2019). Vegetation Survey of the San Carlos Apache Reservation, Arizona and Surrounding Area (September to November 2017). U.S. Geological Survey Data Release. https://doi.org/10.5066/P9OCZ17X.
Norman, L. M., Middleton, B. R., & Wilson, N. R. (2018). Remote sensing analysis of vegetation at the San Carlos Apache Reservation, Arizona and surrounding area. Journal of Applied Remote Sensing, 12(02), 1. https://doi.org/10.1117/1.JRS.12.026017
Petrakis, R. E., Norman, L. M., & Middleton, B. R. (2023a). Mapping Riparian Vegetation Response to Climate Change on the San Carlos Apache Reservation and Upper Gila River Watershed to Inform Restoration Priorities: 1935 to Present—Database of Trends in Vegetation Properties and Climate Adaptation Variables. U.S. Geological Survey Data Release. https://doi.org/10.5066/P9HL0N5T
Petrakis, R. E., Norman, L. M., & Middleton, B. R. (2023b). Riparian vegetation response amid variable climate conditions across the Upper Gila River watershed: Informing Tribal restoration priorities. Frontiers in Environmental Science, 11, 1179328. https://doi.org/10.3389/fenvs.2023.1179328
Petrakis, R. E., Villarreal, M. L., Wu, Z., Hetzler, R., Middleton, B. R., & Norman, L. M. (2018). Evaluating and monitoring forest fuel treatments using remote sensing applications in Arizona, U.S.A. Forest Ecology and Management, 413, 48–61. https://doi.org/10.1016/j.foreco.2018.01.036
Petrakis, R., Wu, Z., McVay, J., Middleton, B., Dye, D., & Vogel, J. (2016). Vegetative response to water availability on the San Carlos Apache Reservation. Forest Ecology and Management, 378, 14–23. https://doi.org/10.1016/j.foreco.2016.07.012
Wu, Z., Dye, D., Stoker, J., Vogel, J., Velasco, M., & Middleton, B. (2016). Evaluating Lidar Point Densities for Effective Estimation of Aboveground Biomass. International Journal of Advanced Remote Sensing and GIS, 5(1), 1483–1499. https://doi.org/10.23953/cloud.ijarsg.40
Wu, Z., Dye, D., Vogel, J., & Middleton, B. (2016). Estimating Forest and Woodland Aboveground Biomass Using Active and Passive Remote Sensing. Photogrammetric Engineering & Remote Sensing, 82(4), 271–281. https://doi.org/10.14358/PERS.82.4.271
Wu, Z., Middleton, B., Hetzler, R., Vogel, J., & Dye, D. (2015). Vegetation Burn Severity Mapping Using Landsat-8 and WorldView-2. Photogrammetric Engineering & Remote Sensing, 81(2), 143–154. https://doi.org/10.14358/PERS.81.2.143
Wu, Z., Velasco, M., McVay, J., Middleton, B., Vogel, J., & Dye, D. (2016). MODIS Derived Vegetation Index for Drought Detection on the San Carlos Apache Reservation. International Journal of Advanced Remote Sensing and GIS, 5(1), 1524–1538. https://doi.org/10.23953/cloud.ijarsg.44
San Carlos Apache Reservation covers 1.8 million acres in east-central Arizona, and has diverse ecosystems and vegetation types that support a natural resource-based economy.
The USGS Western Geographic Science Center has been partnering with collaborators from the San Carlos Apache Tribe (SCAT) and Bureau of Indian Affairs (BIA) to address natural resource questions since 2004. We work with SCAT Departments of Forestry, Range Management and Environmental Protection.
Historically, we’ve developed a relationship with the Tribe, with land management questions, hypotheses, engagement and science to investigate how managers can impact vegetation, fire, and water quality and quantity. Much of the work we do is through the use of remote sensing. Satellites, like Landsat, are incredibly useful for monitoring change because they collect continuous information on a global scale. And with the Landsat series, have been collecting data for over 40 years, allowing us to make Earth observations presently and in the past that can help us to inform future problem solving tied to climate and management challenges.
Photo of partners working together at the San Carlos Apache Reservation in Arizona.
This has resulted in rangeland condition maps, LIDAR density and biomass maps, burn severity maps, and forest and woodland biomass estimates. We also investigate research questions related to wildfire and forest fuel treatments focus on how restoring fire to the land impacts fire severity and overall forest health. Current projects include studying riparian vegetation response to climate, particularly the effects of drought and flooding in the upper Gila River watershed.
Fire Burn Severity
We used remotely sensed data from the Landsat 8 and WorldView-2 satellites to estimate vegetation burn severity of the Creek Fire on the San Carlos Apache Reservation, where wildfire occurrences affect the Tribe’s crucial livestock and logging industries. Accurate pre- and post-fire canopy maps at high (0.5-meter) resolution were created from WorldView-2 data to generate canopy loss maps, and multiple indices from pre- and post-fire Landsat 8 images were used to evaluate vegetation burn severity. Normalized difference vegetation index based vegetation burn severity map had the highest correlation coefficients with canopy loss map from WorldView-2. Two distinct approaches – canopy loss mapping from WorldView-2 and spectral index differencing from Landsat 8, agreed well with the field-based burn severity estimates and are both effective for vegetation burn severity mapping. Canopy loss maps created with WorldView-2 imagery add to a short list of accurate vegetation burn severity mapping techniques that can help guide effective management of forest resources on the San Carlos Apache Reservation, and the broader fire-prone regions of the Southwest.
Aboveground Biomass Estimates with LiDAR
Light Detection and Ranging (lidar) is an increasingly popular Earth observing data type. Lidar is an active remote sensing system that can measure the three-dimensional (3-D) structural characteristics of Earth features, which are not directly captured by passive optical land imaging systems. The U.S. Geological Survey (USGS) 3D Elevation Program (3DEP) was recently established to provide airborne lidar data coverage on a national scale. As part of a broader research effort of the USGS to develop an effective remote sensing-based methodology for the creation of an operational biomass Essential Climate Variable (Biomass ECV) data product, we evaluated the performance of airborne lidar data at various pulse densities against Landsat 8 satellite imagery in estimating above ground biomass for forests and woodlands in a study area in east-central Arizona, U.S. Airborne lidar and Landsat 8 derived metrics were used in linear regression analysis against field based biomass estimates. High point density airborne lidar data were randomly sampled to produce five lidar datasets with reduced densities ranging from 0.5 to 8 point(s)/m2, corresponding to the point density range of 3DEP to provide national lidar coverage over time. Lidar-derived aboveground biomass estimate errors showed an overall decreasing trend as lidar point density increased from 0.5 to 8 points/m2. Landsat 8-based aboveground biomass estimates produced errors larger than the lowest lidar point density of 0.5 point/m2, and therefore Landsat 8 observations alone were ineffective relative to airborne lidar for generating a Biomass ECV product, at least for the forest and woodland vegetation types of the Southwestern U.S. While a national Biomass ECV product with optimal accuracy could potentially be achieved with 3DEP data at 8 points/m2, our results indicate that even lower density lidar data could be sufficient to provide a national Biomass ECV product with accuracies significantly higher than that from Landsat observations alone.
Vegetation Response to Water Availability
A variety of vegetation indices derived from remotely sensed data have been used to assess vegetation conditions, enabling the identification of drought occurrences as well as the evaluation of drought impacts. Moderate Resolution Imaging Spectroradiometer (MODIS) Terra 8-day composite data were used to compute the Modified Soil Adjusted Vegetation Index II (MSAVI2) of four dominant vegetation types over a 13-year period (2002 – 2014) on the San Carlos Apache Reservation in Arizona, US. MSAVI2 anomalies were used to identify adverse impacts of drought on vegetation, characterized as mean MSAVI2 below the 13-year average. In terms of interannual variability, we found similar responses between grassland and shrubland, and between woodland and forest vegetation types. We compared MSAVI2 for specific vegetation types with precipitation data at the same time step, and found a lag time of roughly two months for the peak MSAVI2 values following precipitation in a given year. All vegetation types responded to summer monsoon rainfall, while shrubland and annual herbaceous vegetation also displayed a brief spring growing season following winter precipitation. MSAVI2 values of shrublands corresponded well with precipitation variability both for summer rainfall and winter snowfall, and can be potentially used as a drought indicator on the San Carlos Apache Reservation given its wide geographic distribution. We demonstrated that moderate temporal frequency satellite-based MSAVI2 can provide drought monitoring to inform land management decisions, especially on vegetated tribal land areas where in situ precipitation data are limited.
Riparian Response in the Upper Gila Watershed
FIGURE: A map showing the primary study site, including the San Carlos River and Bylas Reach of the Gila River from Petrakis et al. (2023).
The primary objective of this study was to measure direct relationships between vegetation conditions and climate drivers to help develop a framework to inform predictive management for these riparian forests, with supplemental funding from the Southwest CASC (Mapping Riparian Vegetation Response to Climate).
Products depict how vegetation extent, canopy cover, and composition in the Upper Gila River Watershed riparian zones have changed over time and provide information on the current conditions of the vegetation in response to climatic factors and river discharge. Using aerial and satellite imagery over an 84-year time frame, USGS scientists are working with resource managers from the San Carlos Apache Tribe to identify restoration and vegetation management actions that would provide value to stakeholders and local residents throughout the region
Significant findings from this work indicate that drought-stressed tamarisk contributed to high-severity wildfire, burned bridges, and combustible infrastructure during the 2021 Bottom Fire. Researchers found that tamarisk grows faster and stronger after disturbances like wildfire and exhibits greater drought stress than native species. As part of this project, USGS worked with SCAT to help lead a training to monitor the tamarisk beetle, on-the-ground, in real time as it works its way onto the Reservation from the north and east.
Natural Infrastructure in Dryland Streams (NIDS) including rock detention structures, beaver dams and their analogs, and check dams have been shown to be an effective restoration strategy used by the Tribe and others for increasing water availability, regulating flows, and reducing flood and erosion risks (Norman et al. 2022).
PHOTOS: Community members of the SCAT collecting tamarisk beetles on the Reservation (photo by Roy Petrakis, USGS) and USGS scientists teaching at the San Carlos Apache Tribe Summer Youth Practicum for Environmental Protection where the kids were talking about, learning about, and building NIDS (photo by Christy Sangster Begay, SCAT).
Future research questions include how tamarisk leaf beetle defoliation affects fire risk, how watershed conditions are impacted by forest and range treatments, and additional inquiries related to watershed health and flood risk.
Video
For an overview of some of the work we have completed, check this webinar let by partners at the San Carlos Apache Tribe
Southwest & South Central CASC Tribal Climate Resilience Webinar 08 05 25
Goseyun, T., Lister, N., and Richens, C., 2024, Juniper Tank Pasture Rehabilitation, part of the USGS hosted, Human-Built Natural Infrastructure in Dryland Streams — Lessons from the "20-Year Crew" session at the National Conference on Ecosystem Restoration, in Albuquerque, NM, https://youtu.be/1O_rCzhpIwk?si=HePX7sRfeycTpFP4
PUBLICATIONS:
Middleton, B., & Norman, L. (2021). Remote Sensing Analysis to Quantify Change in Woodland Canopy Cover on the San Carlos Apache Reservation, Arizona, USA (1935 vs. 2017). Land, 10(4), 393. https://doi.org/10.3390/land10040393
Middleton, B. R., Wilson, N. R., & Norman, L. M. (2019). Vegetation Survey of the San Carlos Apache Reservation, Arizona and Surrounding Area (September to November 2017). U.S. Geological Survey Data Release. https://doi.org/10.5066/P9OCZ17X.
Norman, L. M., Middleton, B. R., & Wilson, N. R. (2018). Remote sensing analysis of vegetation at the San Carlos Apache Reservation, Arizona and surrounding area. Journal of Applied Remote Sensing, 12(02), 1. https://doi.org/10.1117/1.JRS.12.026017
Petrakis, R. E., Norman, L. M., & Middleton, B. R. (2023a). Mapping Riparian Vegetation Response to Climate Change on the San Carlos Apache Reservation and Upper Gila River Watershed to Inform Restoration Priorities: 1935 to Present—Database of Trends in Vegetation Properties and Climate Adaptation Variables. U.S. Geological Survey Data Release. https://doi.org/10.5066/P9HL0N5T
Petrakis, R. E., Norman, L. M., & Middleton, B. R. (2023b). Riparian vegetation response amid variable climate conditions across the Upper Gila River watershed: Informing Tribal restoration priorities. Frontiers in Environmental Science, 11, 1179328. https://doi.org/10.3389/fenvs.2023.1179328
Petrakis, R. E., Villarreal, M. L., Wu, Z., Hetzler, R., Middleton, B. R., & Norman, L. M. (2018). Evaluating and monitoring forest fuel treatments using remote sensing applications in Arizona, U.S.A. Forest Ecology and Management, 413, 48–61. https://doi.org/10.1016/j.foreco.2018.01.036
Petrakis, R., Wu, Z., McVay, J., Middleton, B., Dye, D., & Vogel, J. (2016). Vegetative response to water availability on the San Carlos Apache Reservation. Forest Ecology and Management, 378, 14–23. https://doi.org/10.1016/j.foreco.2016.07.012
Wu, Z., Dye, D., Stoker, J., Vogel, J., Velasco, M., & Middleton, B. (2016). Evaluating Lidar Point Densities for Effective Estimation of Aboveground Biomass. International Journal of Advanced Remote Sensing and GIS, 5(1), 1483–1499. https://doi.org/10.23953/cloud.ijarsg.40
Wu, Z., Dye, D., Vogel, J., & Middleton, B. (2016). Estimating Forest and Woodland Aboveground Biomass Using Active and Passive Remote Sensing. Photogrammetric Engineering & Remote Sensing, 82(4), 271–281. https://doi.org/10.14358/PERS.82.4.271
Wu, Z., Middleton, B., Hetzler, R., Vogel, J., & Dye, D. (2015). Vegetation Burn Severity Mapping Using Landsat-8 and WorldView-2. Photogrammetric Engineering & Remote Sensing, 81(2), 143–154. https://doi.org/10.14358/PERS.81.2.143
Wu, Z., Velasco, M., McVay, J., Middleton, B., Vogel, J., & Dye, D. (2016). MODIS Derived Vegetation Index for Drought Detection on the San Carlos Apache Reservation. International Journal of Advanced Remote Sensing and GIS, 5(1), 1524–1538. https://doi.org/10.23953/cloud.ijarsg.44