
Weather sensor and rain gage, USGS 390325074455401 Stone Harbor USGS Weather Station, mounted along with USGS
Does the USGS provide precipitation data?
NOAA is the federal agency tasked with collecting climate-grade precipitation data for the nation. Their rain gauges are usually located at manned sites where a local observer checks readings daily and performs regular maintenance.
The USGS collects precipitation data at about 3,400 locations around the country, mostly where we already have streamgages (so at roughly a quarter of our streamgages). USGS streamgages are only visited about once every six weeks, so our precipitation equipment is infrequently calibrated and tested.
Some USGS rain gages are considered “operational” and assist with evaluation of the streamflow records at the location, and in those cases, the USGS precipitation data is only available online for 120 days. Data are published where we have been asked and funded to do so by another cooperating agency. All USGS precipitation data are used by the National Weather Service to aid in calibration of their precipitation radar estimates and flood warnings.
Learn More:
Related

What is the difference between weather and climate change? What is the difference between weather and climate change?
Weather refers to short term atmospheric conditions while climate is the weather of a specific region averaged over a long period of time. Climate change refers to long-term changes.

Is there a way to get alerts about streamflow conditions? Is there a way to get alerts about streamflow conditions?
Yes! The U.S. Geological Survey WaterAlert service provides notifications to your email or phone for changes in water conditions based on thresholds you choose.

Why does the USGS use the spelling "gage" instead of "gauge"? Why does the USGS use the spelling "gage" instead of "gauge"?
The spelling of “gage” is part of our very rich USGS history. We have used that spelling for over a hundred years. In 1888, USGS Director John Wesley Powell met a very forward-thinking graduate student named Frederick Haynes Newell. Powell was so impressed that he made Newell the first full-time appointee to the new Irrigation Survey, which was created to investigate the potential for dams and...

Why are there sometimes differences between USGS and National Weather Service river stages? Why are there sometimes differences between USGS and National Weather Service river stages?
At some USGS streamgage installations, NOAA’s National Weather Service (NWS) maintains a separate stage sensor that is serviced by NWS technicians. Calibration of any sensing device can occasionally drift from a "true" value, so there might be differences between USGS and NWS data reports. USGS personnel visit installations on an interval of 6 weeks or less to maintain equipment and make required...

How often are real-time streamflow data updated? How often are real-time streamflow data updated?
USGS real-time streamflow data are typically recorded at 15-minute intervals, stored onsite, and then transmitted to USGS offices once every hour, depending on the data relay technique used. Recording and transmission times might be more frequent during critical events (floods, for example). Data from current sites are relayed to USGS offices via satellite, telephone, and/or radio telemetry and...

How do we benefit from USGS streamgages? How do we benefit from USGS streamgages?
Information on the flow of rivers is a vital national asset that safeguards lives, protects property, and ensures adequate water supplies for the future. The USGS is the federal agency responsible for operating a network of about 7,000 streamgages nationwide. Data from this network are used by water managers, emergency responders, utilities, environmental agencies, universities, consulting firms...
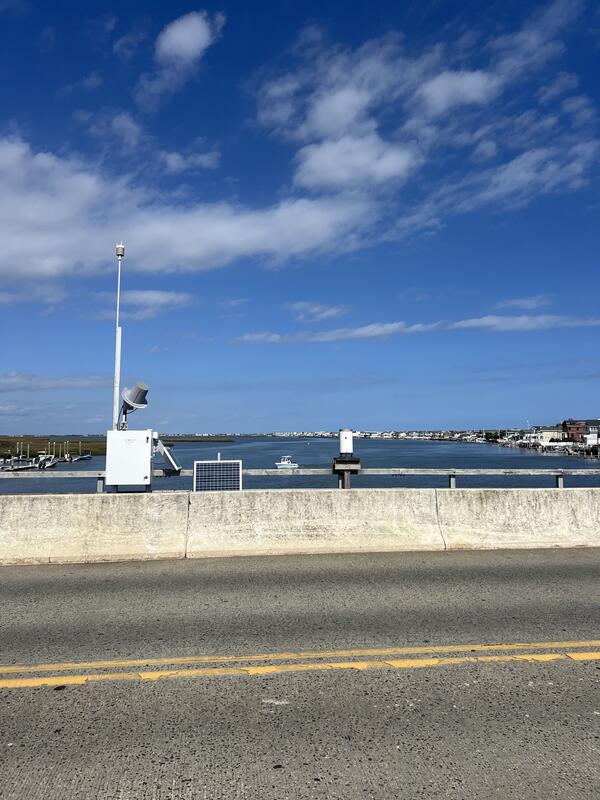
Coastal Weather Station
Weather sensor and rain gage, USGS 390325074455401 Stone Harbor USGS Weather Station, mounted along with USGS

Weather station on Kahiltna Glacier
USGS scientist Louis Sass assesses an on-glacier weather station on the Kahiltna Glacier in Denali National Park, Alaska. This weather station is located at Kahiltna Base Camp, where climbers attempting to summit Denali begin their ascent. Sultana (Mt. Foraker) is visible in the background.
USGS scientist Louis Sass assesses an on-glacier weather station on the Kahiltna Glacier in Denali National Park, Alaska. This weather station is located at Kahiltna Base Camp, where climbers attempting to summit Denali begin their ascent. Sultana (Mt. Foraker) is visible in the background.

Scientists installing a wind and rain gauge on Ofu, American Samoa
Scientists installing a wind and rain gauge on Ofu, American SamoaScientists installing a wind and rain gauge in the National Park of American Samoa on Ofu.
Scientists installing a wind and rain gauge on Ofu, American Samoa
Scientists installing a wind and rain gauge on Ofu, American SamoaScientists installing a wind and rain gauge in the National Park of American Samoa on Ofu.

USGS Precipitation Gage at Franklin Middle School in Fairfax County
USGS Precipitation Gage at Franklin Middle School in Fairfax CountyPhotograph of the USGS precipitation gage located at Fairfax Middle School in Fairfax County. Data for this station can be found on USGS Water Data For the Nation.
USGS Precipitation Gage at Franklin Middle School in Fairfax County
USGS Precipitation Gage at Franklin Middle School in Fairfax CountyPhotograph of the USGS precipitation gage located at Fairfax Middle School in Fairfax County. Data for this station can be found on USGS Water Data For the Nation.

Rain gauge installed in Glenwood Canyon, Colorado
Rain gauge installed in Glenwood Canyon, Colorado. After the 2020 Grizzly Creek fire, scientists installed a network of rain gauges and soil moisture sensors throughout the rugged burn area. These instruments provide real-time data on rainfall intensity and duration, which are critical factors in determining the likelihood of a debris flow.
Rain gauge installed in Glenwood Canyon, Colorado. After the 2020 Grizzly Creek fire, scientists installed a network of rain gauges and soil moisture sensors throughout the rugged burn area. These instruments provide real-time data on rainfall intensity and duration, which are critical factors in determining the likelihood of a debris flow.

Grizzly Bay dolphin with weather station installed on top
Grizzly Bay dolphin with weather station installed on topA structure called a dolphin, permanently affixed in the sediment, stands in Grizzly Bay near San Francisco, CA, with a weather station installed on top. The USGS will use the data from the weather station in conjunction with other oceanographic data, in their studies of sediment movement in the bay.

The Garden Wall weather station in Glacier National Park (elev. 7400)
The Garden Wall weather station in Glacier National Park (elev. 7400)The Garden Wall weather station in Glacier National Park (elev. 7400 feet) is used for avalanche research and forecasting along the Going-to-the-Sun Road. It records air temperature, relative humidity, wind speed and direction, and incoming and outgoing shortwave and longwave radiation.

White River at Hazelton, IN - bridge view of rain gage equipment
White River at Hazelton, IN - bridge view of rain gage equipmentWhite River at Hazelton, IN - bridge view of rain gage location
White River at Hazelton, IN - bridge view of rain gage equipment
White River at Hazelton, IN - bridge view of rain gage equipmentWhite River at Hazelton, IN - bridge view of rain gage location

White River at Hazelton IN - closeup of rain gage equipment on bridge
White River at Hazelton IN - closeup of rain gage equipment on bridgeWhite River at Hazelton IN - closeup of rain gage equipment on bridge
White River at Hazelton IN - closeup of rain gage equipment on bridge
White River at Hazelton IN - closeup of rain gage equipment on bridgeWhite River at Hazelton IN - closeup of rain gage equipment on bridge

Installing Precipitation Gage
During August 2013, the Beaver Creek wildfire burned more than 114,000 acres near the south-central Idaho communities of Sun Valley, Ketchum, and Hailey. Partnering with Blaine County, the USGS installed a network of real-time precipitation gages in the burn area.
During August 2013, the Beaver Creek wildfire burned more than 114,000 acres near the south-central Idaho communities of Sun Valley, Ketchum, and Hailey. Partnering with Blaine County, the USGS installed a network of real-time precipitation gages in the burn area.
Related
What is the difference between weather and climate change? What is the difference between weather and climate change?
Weather refers to short term atmospheric conditions while climate is the weather of a specific region averaged over a long period of time. Climate change refers to long-term changes.
Is there a way to get alerts about streamflow conditions? Is there a way to get alerts about streamflow conditions?
Yes! The U.S. Geological Survey WaterAlert service provides notifications to your email or phone for changes in water conditions based on thresholds you choose.
Why does the USGS use the spelling "gage" instead of "gauge"? Why does the USGS use the spelling "gage" instead of "gauge"?
The spelling of “gage” is part of our very rich USGS history. We have used that spelling for over a hundred years. In 1888, USGS Director John Wesley Powell met a very forward-thinking graduate student named Frederick Haynes Newell. Powell was so impressed that he made Newell the first full-time appointee to the new Irrigation Survey, which was created to investigate the potential for dams and...
Why are there sometimes differences between USGS and National Weather Service river stages? Why are there sometimes differences between USGS and National Weather Service river stages?
At some USGS streamgage installations, NOAA’s National Weather Service (NWS) maintains a separate stage sensor that is serviced by NWS technicians. Calibration of any sensing device can occasionally drift from a "true" value, so there might be differences between USGS and NWS data reports. USGS personnel visit installations on an interval of 6 weeks or less to maintain equipment and make required...
How often are real-time streamflow data updated? How often are real-time streamflow data updated?
USGS real-time streamflow data are typically recorded at 15-minute intervals, stored onsite, and then transmitted to USGS offices once every hour, depending on the data relay technique used. Recording and transmission times might be more frequent during critical events (floods, for example). Data from current sites are relayed to USGS offices via satellite, telephone, and/or radio telemetry and...
How do we benefit from USGS streamgages? How do we benefit from USGS streamgages?
Information on the flow of rivers is a vital national asset that safeguards lives, protects property, and ensures adequate water supplies for the future. The USGS is the federal agency responsible for operating a network of about 7,000 streamgages nationwide. Data from this network are used by water managers, emergency responders, utilities, environmental agencies, universities, consulting firms...
Coastal Weather Station
Weather sensor and rain gage, USGS 390325074455401 Stone Harbor USGS Weather Station, mounted along with USGS
Weather sensor and rain gage, USGS 390325074455401 Stone Harbor USGS Weather Station, mounted along with USGS
Weather station on Kahiltna Glacier
USGS scientist Louis Sass assesses an on-glacier weather station on the Kahiltna Glacier in Denali National Park, Alaska. This weather station is located at Kahiltna Base Camp, where climbers attempting to summit Denali begin their ascent. Sultana (Mt. Foraker) is visible in the background.
USGS scientist Louis Sass assesses an on-glacier weather station on the Kahiltna Glacier in Denali National Park, Alaska. This weather station is located at Kahiltna Base Camp, where climbers attempting to summit Denali begin their ascent. Sultana (Mt. Foraker) is visible in the background.
Scientists installing a wind and rain gauge on Ofu, American Samoa
Scientists installing a wind and rain gauge on Ofu, American SamoaScientists installing a wind and rain gauge in the National Park of American Samoa on Ofu.
Scientists installing a wind and rain gauge on Ofu, American Samoa
Scientists installing a wind and rain gauge on Ofu, American SamoaScientists installing a wind and rain gauge in the National Park of American Samoa on Ofu.
USGS Precipitation Gage at Franklin Middle School in Fairfax County
USGS Precipitation Gage at Franklin Middle School in Fairfax CountyPhotograph of the USGS precipitation gage located at Fairfax Middle School in Fairfax County. Data for this station can be found on USGS Water Data For the Nation.
USGS Precipitation Gage at Franklin Middle School in Fairfax County
USGS Precipitation Gage at Franklin Middle School in Fairfax CountyPhotograph of the USGS precipitation gage located at Fairfax Middle School in Fairfax County. Data for this station can be found on USGS Water Data For the Nation.
Rain gauge installed in Glenwood Canyon, Colorado
Rain gauge installed in Glenwood Canyon, Colorado. After the 2020 Grizzly Creek fire, scientists installed a network of rain gauges and soil moisture sensors throughout the rugged burn area. These instruments provide real-time data on rainfall intensity and duration, which are critical factors in determining the likelihood of a debris flow.
Rain gauge installed in Glenwood Canyon, Colorado. After the 2020 Grizzly Creek fire, scientists installed a network of rain gauges and soil moisture sensors throughout the rugged burn area. These instruments provide real-time data on rainfall intensity and duration, which are critical factors in determining the likelihood of a debris flow.
Grizzly Bay dolphin with weather station installed on top
Grizzly Bay dolphin with weather station installed on topA structure called a dolphin, permanently affixed in the sediment, stands in Grizzly Bay near San Francisco, CA, with a weather station installed on top. The USGS will use the data from the weather station in conjunction with other oceanographic data, in their studies of sediment movement in the bay.
The Garden Wall weather station in Glacier National Park (elev. 7400)
The Garden Wall weather station in Glacier National Park (elev. 7400)The Garden Wall weather station in Glacier National Park (elev. 7400 feet) is used for avalanche research and forecasting along the Going-to-the-Sun Road. It records air temperature, relative humidity, wind speed and direction, and incoming and outgoing shortwave and longwave radiation.
White River at Hazelton, IN - bridge view of rain gage equipment
White River at Hazelton, IN - bridge view of rain gage equipmentWhite River at Hazelton, IN - bridge view of rain gage location
White River at Hazelton, IN - bridge view of rain gage equipment
White River at Hazelton, IN - bridge view of rain gage equipmentWhite River at Hazelton, IN - bridge view of rain gage location
White River at Hazelton IN - closeup of rain gage equipment on bridge
White River at Hazelton IN - closeup of rain gage equipment on bridgeWhite River at Hazelton IN - closeup of rain gage equipment on bridge
White River at Hazelton IN - closeup of rain gage equipment on bridge
White River at Hazelton IN - closeup of rain gage equipment on bridgeWhite River at Hazelton IN - closeup of rain gage equipment on bridge
Installing Precipitation Gage
During August 2013, the Beaver Creek wildfire burned more than 114,000 acres near the south-central Idaho communities of Sun Valley, Ketchum, and Hailey. Partnering with Blaine County, the USGS installed a network of real-time precipitation gages in the burn area.
During August 2013, the Beaver Creek wildfire burned more than 114,000 acres near the south-central Idaho communities of Sun Valley, Ketchum, and Hailey. Partnering with Blaine County, the USGS installed a network of real-time precipitation gages in the burn area.
Updated Date: March 13, 2026