
This is a screen shot of the National Map (TNM) 3D Viewer Application. This new application will replace the existing TNM Viewer on or around April 7th 2025
What sources of vector data were used to create base maps in The National Map?
Vector data for small scales are from The National Map Small-Scale Collection, while medium to large scales are comprised of The National Map themes, including the National Hydrography Dataset (NHD) and Geographic Names Information System (GNIS) data. Other medium-to-large-scale vector features are from USGS edited versions of the U.S. Census Bureau's TIGER/Line data for Governmental Unit Boundaries, Structures, and Transportation.
Related

What map projections are used in The National Map tiled base map services and dynamic overlay services? What map projections are used in The National Map tiled base map services and dynamic overlay services?
The projection used for all tiled base map services in The National Map is the World Geodetic System 1984 (WGS 84) Web Mercator (Auxiliary Sphere) so that base map services can be used in combination with other common viewers. See Spatial Reference SR-ORG:6928 and Spatial Reference SR-ORG:7483. Dynamic overlay services are in WGS84 (see Spatial Reference EPSG:4326) but can be reprojected as needed...

How often are The National Map's composite base maps and dynamic service overlays updated? How often are The National Map's composite base maps and dynamic service overlays updated?
Composite base maps are recached about once a year. Although data in dynamic service overlays are ideally updated quarterly, it can sometimes take up to six months. Please note that there will be times when composite base maps and dynamic service overlays are not in synchronization because of a difference in refresh cycles. Subscribe to the National Map Simple Notifcation Service (SNS) to stay in...

What are the base map services (or URLs) used in The National Map? What are the base map services (or URLs) used in The National Map?
The National Map Services offers a series of composite base maps that combine layers into tile cache services with the cartographic richness of multiple data sources. The following base maps are available: USGS Topo - combines the most current data (boundaries, geographic names, transportation, elevation, hydrography, land cover, and other themes) that make up The National Map. Contours generated...
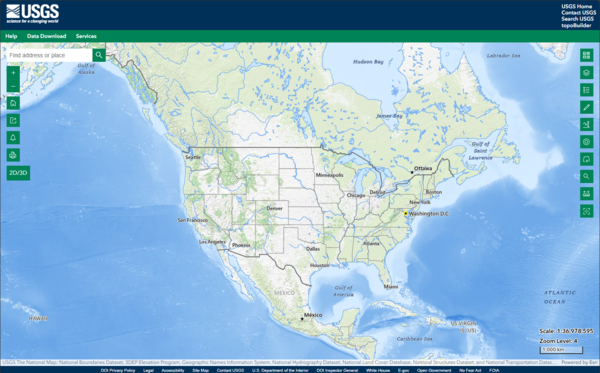
The National Map 3D Viewer
This is a screen shot of the National Map (TNM) 3D Viewer Application. This new application will replace the existing TNM Viewer on or around April 7th 2025
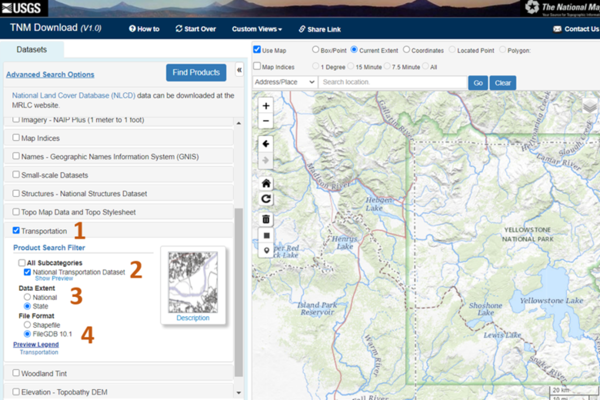
National Map Download Manager Website
The image shows the National Map Download manager website with the Transportation features selected for download.
The image shows the National Map Download manager website with the Transportation features selected for download.

National Map Service Endpoints
The image shows the National Map Service Endpoints website with Theme Overlays and Web Feature Services highlighted.
The image shows the National Map Service Endpoints website with Theme Overlays and Web Feature Services highlighted.

Lesson 4a – Using The National Map Download Application
Lesson 4a – Using The National Map Download ApplicationIn this lesson we will provide a brief introduction on how to use The National Map Download Application. The TNM Download application allows users to explore and access the USGS staged products available for download. This application is a user-friendly version of the USGS staged-product application programming interface, and it is available on most platforms.

Lesson 4d: The National Map Download Manager Tool
In this lesson you will learn how to download and install uGet. You will also learn how to use uGet to download data and maps from The National Map download Client using URLs saved in a text or CSV file.
In this lesson you will learn how to download and install uGet. You will also learn how to use uGet to download data and maps from The National Map download Client using URLs saved in a text or CSV file.

PubTalk 11/2010 — Silicon, Software, and Science
Monitoring the Earth's Landscape with Low-Cost High-Tech
by Rian Bogle, Remote Sensing Specialist
Monitoring the Earth's Landscape with Low-Cost High-Tech
by Rian Bogle, Remote Sensing Specialist
Related
What map projections are used in The National Map tiled base map services and dynamic overlay services? What map projections are used in The National Map tiled base map services and dynamic overlay services?
The projection used for all tiled base map services in The National Map is the World Geodetic System 1984 (WGS 84) Web Mercator (Auxiliary Sphere) so that base map services can be used in combination with other common viewers. See Spatial Reference SR-ORG:6928 and Spatial Reference SR-ORG:7483. Dynamic overlay services are in WGS84 (see Spatial Reference EPSG:4326) but can be reprojected as needed...
How often are The National Map's composite base maps and dynamic service overlays updated? How often are The National Map's composite base maps and dynamic service overlays updated?
Composite base maps are recached about once a year. Although data in dynamic service overlays are ideally updated quarterly, it can sometimes take up to six months. Please note that there will be times when composite base maps and dynamic service overlays are not in synchronization because of a difference in refresh cycles. Subscribe to the National Map Simple Notifcation Service (SNS) to stay in...
What are the base map services (or URLs) used in The National Map? What are the base map services (or URLs) used in The National Map?
The National Map Services offers a series of composite base maps that combine layers into tile cache services with the cartographic richness of multiple data sources. The following base maps are available: USGS Topo - combines the most current data (boundaries, geographic names, transportation, elevation, hydrography, land cover, and other themes) that make up The National Map. Contours generated...
The National Map 3D Viewer
This is a screen shot of the National Map (TNM) 3D Viewer Application. This new application will replace the existing TNM Viewer on or around April 7th 2025
This is a screen shot of the National Map (TNM) 3D Viewer Application. This new application will replace the existing TNM Viewer on or around April 7th 2025
National Map Download Manager Website
The image shows the National Map Download manager website with the Transportation features selected for download.
The image shows the National Map Download manager website with the Transportation features selected for download.
National Map Service Endpoints
The image shows the National Map Service Endpoints website with Theme Overlays and Web Feature Services highlighted.
The image shows the National Map Service Endpoints website with Theme Overlays and Web Feature Services highlighted.
Lesson 4a – Using The National Map Download Application
Lesson 4a – Using The National Map Download ApplicationIn this lesson we will provide a brief introduction on how to use The National Map Download Application. The TNM Download application allows users to explore and access the USGS staged products available for download. This application is a user-friendly version of the USGS staged-product application programming interface, and it is available on most platforms.
Lesson 4d: The National Map Download Manager Tool
In this lesson you will learn how to download and install uGet. You will also learn how to use uGet to download data and maps from The National Map download Client using URLs saved in a text or CSV file.
In this lesson you will learn how to download and install uGet. You will also learn how to use uGet to download data and maps from The National Map download Client using URLs saved in a text or CSV file.
PubTalk 11/2010 — Silicon, Software, and Science
Monitoring the Earth's Landscape with Low-Cost High-Tech
by Rian Bogle, Remote Sensing Specialist
Monitoring the Earth's Landscape with Low-Cost High-Tech
by Rian Bogle, Remote Sensing Specialist
Updated Date: June 26, 2025