U.S. flag

An official website of the United States government

Multimedia

Images

This shaded relief map shows the Long Valley Caldera, Lake Crowley, and the town of Mammoth Lakes. Highway 395 cuts diagonally across the caldera from northwest to southeast. In the center of the map, a label shows the location of GPS station KRAC/KRAK.
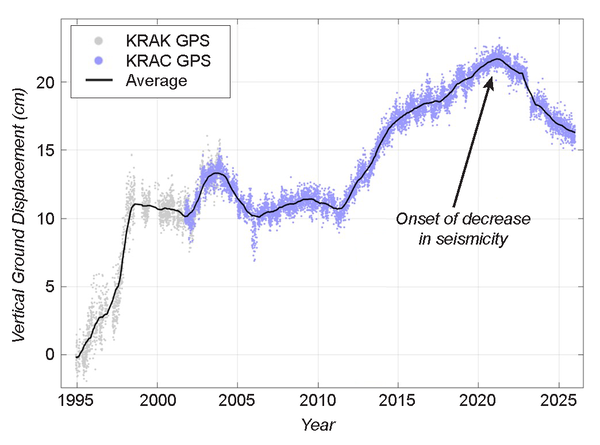
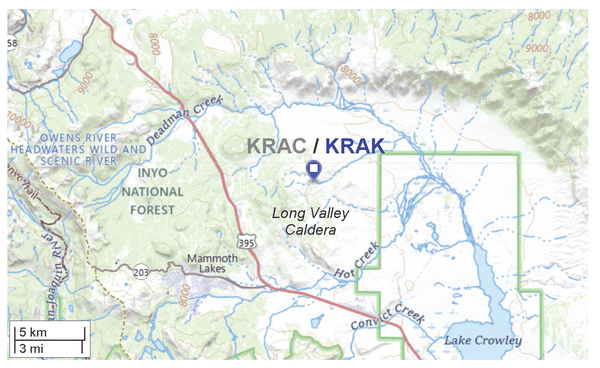
Location of GPS (GNSS) station KRAC/KRAK in the Long Valley Caldera

The location of GPS station KRAC and its predecessor KRAK, slightly north of the center of deflation in Long Valley. USGS figure by Josh Crozier and Alicia Hotovec-Ellis.

A line graph shows the average vertical position of a GPS station over time in centimeters, starting in 1995. The graph starts at 0, rises to 10 cm in 2000, peaks at 15 dcm in 2004, then begins climbing again in 2012. It reaches a peak of 22 cm in 2022, labeled with an arrow and "onset of decrease in seismicity", then decreases to 15 cm by 2025. Small blue dots scattered above and below the line show individual measurements from the station.
The average of individual measurements from GPS station KRAC/KRAK in the Long Valley Caldera, 1995-2025

The average of individual measurements from GPS station KRAC/KRAK shows about 6 cm of ground subsidence since 2021. The multi-year deflation stands out above smaller fluctuations caused by noise in the data and seasonal water infiltration (the peaks and troughs in the dots for individual measurements). USGS figure by Josh Crozier and Alicia Hotovec-Ellis.

The average of individual measurements from GPS station KRAC/KRAK shows about 6 cm of ground subsidence since 2021. The multi-year deflation stands out above smaller fluctuations caused by noise in the data and seasonal water infiltration (the peaks and troughs in the dots for individual measurements). USGS figure by Josh Crozier and Alicia Hotovec-Ellis.

This map shows the Mono Lake - Long Valley region and part of the Sierra Nevada to the south. The landscape is shown in shades of gray while earthquakes are depicted with orange dots scaled according to the earthquake's magnitude. Black lines indicate where seismic monitoring boxes are drawn around Mono Lake, the Long Valley Caldera, the Sierra Nevada, and Mammoth Mountain.
Map of the Long Valley region with earthquakes from 2025

Locations of earthquakes of at least magnitude 1.0 in 2025 and the outlines of the boxes CalVO uses to count earthquakes around Long Valley. Only 6 earthquakes were located inside the Long Valley Caldera box. (Earthquake location data from Northern California Seismic Network.) Figure by Alicia Hotovec-Ellis, USGS. 

Locations of earthquakes of at least magnitude 1.0 in 2025 and the outlines of the boxes CalVO uses to count earthquakes around Long Valley. Only 6 earthquakes were located inside the Long Valley Caldera box. (Earthquake location data from Northern California Seismic Network.) Figure by Alicia Hotovec-Ellis, USGS. 

Two line graphs show the yearly number of earthquakes over since 1980 in the Long Valley Caldera and the Sierra Nevada south of the caldera. Several annotations write out the numbers of earthquakes in a few years, including 2025.
Earthquakes per year from 1980-2026 in Long Valley and the nearby Sierra Nevada

Graphs of the number of earthquakes located each year since 1980 in the Long Valley Caldera and nearby Sierra Block monitoring boxes. Note that the number of earthquakes on the left shown on a logarithmic scale, which means they increase an order of magnitude with each "step." Figure by Alicia Hotovec-Ellis, USGS.

Graphs of the number of earthquakes located each year since 1980 in the Long Valley Caldera and nearby Sierra Block monitoring boxes. Note that the number of earthquakes on the left shown on a logarithmic scale, which means they increase an order of magnitude with each "step." Figure by Alicia Hotovec-Ellis, USGS.

In this photo of a bare, rocky hill in the middle of a fire-blackened forest, a pole and strapping are laying on the ground next to a charred stump. In the foreground, a dented and warped box contains the melted remains of several large bits of electronics. USGS photo by Ryan Presser, NCSN.
Fire-damaged seismic station in the Lassen Volcanic Center

This seismic station in the Lassen Volcanic Center was damaged during the Dixie Fire of 2021, which burned huge swathes of forest in the Lassen Volcanic National Park. Above-ground equipment, including the tree that held the antenna and solar panel above winter snows, was destroyed; belowground seismic sensors were recoverable. USGS photo by Ryan Presser, NCSN.

This seismic station in the Lassen Volcanic Center was damaged during the Dixie Fire of 2021, which burned huge swathes of forest in the Lassen Volcanic National Park. Above-ground equipment, including the tree that held the antenna and solar panel above winter snows, was destroyed; belowground seismic sensors were recoverable. USGS photo by Ryan Presser, NCSN.

A stylized circular logo reads "California Volcano Observatory U.S. Geological Survey" in black on gray font with a central vector image of a brown bear in profile on red ground. Green forests are visible in the mid ground and the two peaks of Mount Shasta and Shastina are shown in the distance.
USGS California Volcano Observatory logo

The California Volcano Observatory was created in 2012. Its logo shows Mount Shasta with a California grizzly bear (extinct) in the foreground.

The California Volcano Observatory was created in 2012. Its logo shows Mount Shasta with a California grizzly bear (extinct) in the foreground.

Was this page helpful?