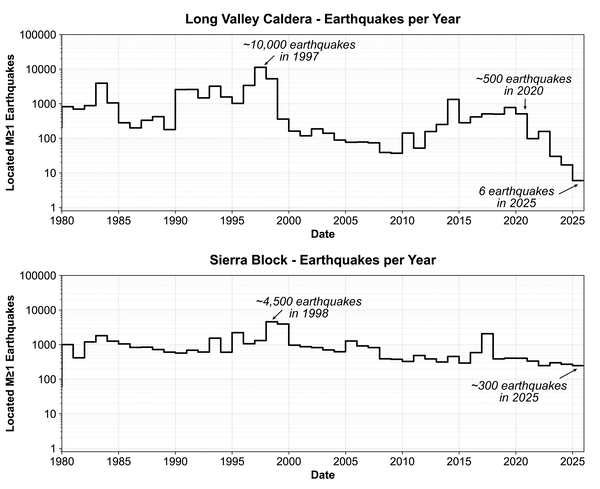
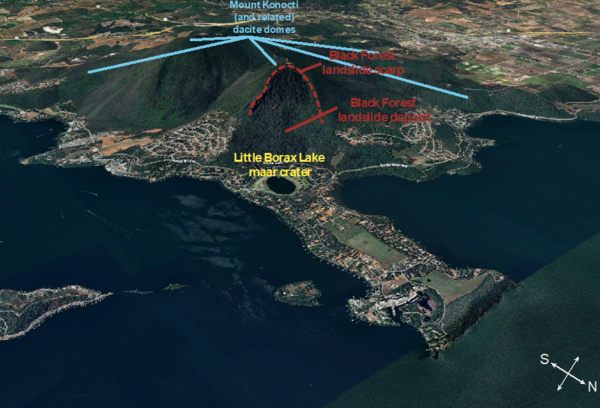
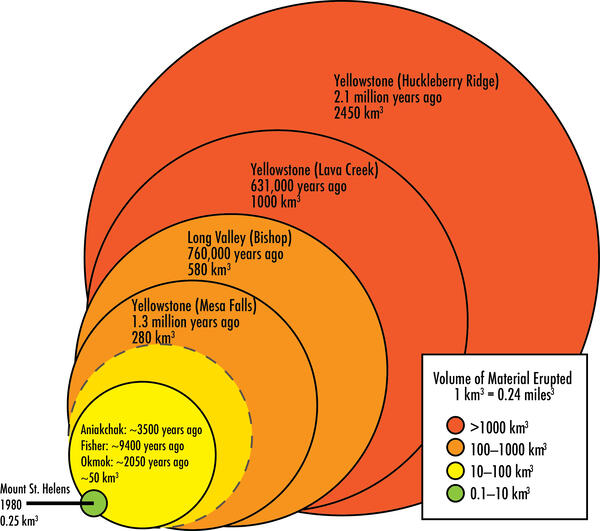
U.S. flag

An official website of the United States government

Images

California Volcano Observatory images.

Filter Total Items: 164
This shaded relief map shows the Long Valley Caldera, Lake Crowley, and the town of Mammoth Lakes. Highway 395 cuts diagonally across the caldera from northwest to southeast. In the center of the map, a label shows the location of GPS station KRAC/KRAK.
Location of GPS (GNSS) station KRAC/KRAK in the Long Valley Caldera

The location of GPS station KRAC and its predecessor KRAK, slightly north of the center of deflation in Long Valley. USGS figure by Josh Crozier and Alicia Hotovec-Ellis.

A line graph shows the average vertical position of a GPS station over time in centimeters, starting in 1995. The graph starts at 0, rises to 10 cm in 2000, peaks at 15 dcm in 2004, then begins climbing again in 2012. It reaches a peak of 22 cm in 2022, labeled with an arrow and "onset of decrease in seismicity", then decreases to 15 cm by 2025. Small blue dots scattered above and below the line show individual measurements from the station.
The average of individual measurements from GPS station KRAC/KRAK in the Long Valley Caldera, 1995-2025

The average of individual measurements from GPS station KRAC/KRAK shows about 6 cm of ground subsidence since 2021. The multi-year deflation stands out above smaller fluctuations caused by noise in the data and seasonal water infiltration (the peaks and troughs in the dots for individual measurements). USGS figure by Josh Crozier and Alicia Hotovec-Ellis.

The average of individual measurements from GPS station KRAC/KRAK shows about 6 cm of ground subsidence since 2021. The multi-year deflation stands out above smaller fluctuations caused by noise in the data and seasonal water infiltration (the peaks and troughs in the dots for individual measurements). USGS figure by Josh Crozier and Alicia Hotovec-Ellis.

This map shows the Mono Lake - Long Valley region and part of the Sierra Nevada to the south. The landscape is shown in shades of gray while earthquakes are depicted with orange dots scaled according to the earthquake's magnitude. Black lines indicate where seismic monitoring boxes are drawn around Mono Lake, the Long Valley Caldera, the Sierra Nevada, and Mammoth Mountain.
Map of the Long Valley region with earthquakes from 2025

Locations of earthquakes of at least magnitude 1.0 in 2025 and the outlines of the boxes CalVO uses to count earthquakes around Long Valley. Only 6 earthquakes were located inside the Long Valley Caldera box. (Earthquake location data from Northern California Seismic Network.) Figure by Alicia Hotovec-Ellis, USGS. 

Locations of earthquakes of at least magnitude 1.0 in 2025 and the outlines of the boxes CalVO uses to count earthquakes around Long Valley. Only 6 earthquakes were located inside the Long Valley Caldera box. (Earthquake location data from Northern California Seismic Network.) Figure by Alicia Hotovec-Ellis, USGS. 

Two line graphs show the yearly number of earthquakes over since 1980 in the Long Valley Caldera and the Sierra Nevada south of the caldera. Several annotations write out the numbers of earthquakes in a few years, including 2025.
Earthquakes per year from 1980-2026 in Long Valley and the nearby Sierra Nevada

Graphs of the number of earthquakes located each year since 1980 in the Long Valley Caldera and nearby Sierra Block monitoring boxes. Note that the number of earthquakes on the left shown on a logarithmic scale, which means they increase an order of magnitude with each "step." Figure by Alicia Hotovec-Ellis, USGS.

Graphs of the number of earthquakes located each year since 1980 in the Long Valley Caldera and nearby Sierra Block monitoring boxes. Note that the number of earthquakes on the left shown on a logarithmic scale, which means they increase an order of magnitude with each "step." Figure by Alicia Hotovec-Ellis, USGS.

In this photo of a bare, rocky hill in the middle of a fire-blackened forest, a pole and strapping are laying on the ground next to a charred stump. In the foreground, a dented and warped box contains the melted remains of several large bits of electronics. USGS photo by Ryan Presser, NCSN.
Fire-damaged seismic station in the Lassen Volcanic Center

This seismic station in the Lassen Volcanic Center was damaged during the Dixie Fire of 2021, which burned huge swathes of forest in the Lassen Volcanic National Park. Above-ground equipment, including the tree that held the antenna and solar panel above winter snows, was destroyed; belowground seismic sensors were recoverable. USGS photo by Ryan Presser, NCSN.

This seismic station in the Lassen Volcanic Center was damaged during the Dixie Fire of 2021, which burned huge swathes of forest in the Lassen Volcanic National Park. Above-ground equipment, including the tree that held the antenna and solar panel above winter snows, was destroyed; belowground seismic sensors were recoverable. USGS photo by Ryan Presser, NCSN.

A stylized circular logo reads "California Volcano Observatory U.S. Geological Survey" in black on gray font with a central vector image of a brown bear in profile on red ground. Green forests are visible in the mid ground and the two peaks of Mount Shasta and Shastina are shown in the distance.
USGS California Volcano Observatory logo

The California Volcano Observatory was created in 2012. Its logo shows Mount Shasta with a California grizzly bear (extinct) in the foreground.

The California Volcano Observatory was created in 2012. Its logo shows Mount Shasta with a California grizzly bear (extinct) in the foreground.

A silvery scientific instrument in a wooden room. The instrument consists of two open frameworks of slotted gray aluminum bars, in which is a large silver cylinder with another off to it side. Cables and tubes snake out of the instrument to power outlets, motor boxes, and sensor boxes. The instrument is tall and protrudes into an opening in the roof of the room.
Cryogenic magnetometer in the USGS California Volcano Observatory Paleomagnetics Laboratory

The cryogenic magnetometer within the shielded room in the U.S. Geological Survey Paleomagnetics Laboratory. Major features of the cryogenic magnetometer are labeled. Picture by A. Pivarunas (U.S. Geological Survey)

Aerial view of Mount Konocti, highlighting Little Borax Lake, the Black Forest landslide scarp and deposits
The lava dome complex of Mount Konocti, Clear Lake Volcanic Field

Roughly a third of the total erupted volume of the Clear Lake volcanic field is represented by the ~ 35 km3 of rocks comprising Mt. Konocti and nearby hills. The mountain itself is over 1200 m (~4000 ft) high and is comprised primarily of a series of dacitic lava domes – Buckingham Peak, Wright Peak, and South Peak, and Howard Peak are all dacites.

Roughly a third of the total erupted volume of the Clear Lake volcanic field is represented by the ~ 35 km3 of rocks comprising Mt. Konocti and nearby hills. The mountain itself is over 1200 m (~4000 ft) high and is comprised primarily of a series of dacitic lava domes – Buckingham Peak, Wright Peak, and South Peak, and Howard Peak are all dacites.

Map of faults around the Geysers Geothermal Field with the Maacama in green and Collayami in purple
Faults bounding the Geysers Geothermal Complex

Just as the Bartlett Springs and Maacama faults are the major bounding faults of the Clear Lake volcanic field, the Collayami (purple) and Maacama (green) faults bound the Geysers Geothermal Field.

Just as the Bartlett Springs and Maacama faults are the major bounding faults of the Clear Lake volcanic field, the Collayami (purple) and Maacama (green) faults bound the Geysers Geothermal Field.

Map of faults around the Clear Lake volcanic field, highlighting the Bartlett Springs and Maacama faults and the field bounds
Faults bounding the Clear Lake Volcanic Field

The Clear Lake volcanic field erupted in association with and within the San Andreas Fault Zone. Although the San Andreas fault is the hallmark fault associated with the transform tectonic boundary between the Pacific and North American plates, the “boundary” between plates is more accurately described by a zone of faulting than by a single fault.

The Clear Lake volcanic field erupted in association with and within the San Andreas Fault Zone. Although the San Andreas fault is the hallmark fault associated with the transform tectonic boundary between the Pacific and North American plates, the “boundary” between plates is more accurately described by a zone of faulting than by a single fault.

An oblique map view of Cobb Mountain and surrounding landscape, featuring Clear Lake, Mount Konocti, and The Geysers
Cobb Mountain and The Geysers geothermal field

At over 4700ft (1440 m), Cobb Mountain is the tallest peak in the Mayacamas Mountains. Cobb Mountain is comprised entirely of ~ 1 million-year-old silica-rich volcanic rocks related to the Clear Lake volcanic field.

At over 4700ft (1440 m), Cobb Mountain is the tallest peak in the Mayacamas Mountains. Cobb Mountain is comprised entirely of ~ 1 million-year-old silica-rich volcanic rocks related to the Clear Lake volcanic field.

A geologist wearing a green USGS shirt and ballcap is seen from the back, standing at the top of a hill overlooking a lake and a large mountain. The lake is divided by a long peninsula dotted with homes and trees, and the mountain has two prominent peaks that are covered in dark forest.
Mount Konocti, Clear Lake Volcanic Field, and CalVO geologist Seth Burgess

CalVO geologist Seth Burgess looking across Clear Lake at Mount Konocti, a prominent volcanic dome complex within the Clear Lake volcanic field. Photo courtesy of Alexander Rubin.

A 3D block diagram showing a cross-section of geologic layers being split by a fault. The block on the right side of the diagram is moving away from the viewer past the block on the left, splitting a surface stream.
Transform fault
Transform fault
Transform fault

Block diagram of a lateral (strike-slip) fault, where two blocks are moving sideways past each other without vertical motion. 

Block diagram of a lateral (strike-slip) fault, where two blocks are moving sideways past each other without vertical motion. 

A 3D block diagram showing a cross-section of geologic layers being split by a fault. The block on the right side of the diagram is being dropped down along an incline below the block on the left.
Normal fault
Normal fault
Normal fault

Block diagram of a normal fault, where the footwall drops below the level of the headwall

Block diagram of a normal fault, where the footwall drops below the level of the headwall

A 3D block diagram showing a cross-section of geologic layers being split by a fault. The block on the right side of the diagram is being pushed up along an incline over the block on the left.
Reverse fault
Reverse fault
Reverse fault

Block diagram of a reverse fault, where the headwall is being pushed above the level of the footwall

Block diagram of a reverse fault, where the headwall is being pushed above the level of the footwall

Four grayscale images of slices of angular crystals with bright rims and darker interiors, surrounded by flecks of light gray crystal fragments like confetti. Some of the crystals have bright white patches where inclusions exist, and some have dark cracks running through them. Colored text and dots show where chemical analyses were conducted with an electron beam
Back-scattered electron images of olivine and chromium spinel crystals

Back-scattered electron images of olivine and chromium spinel crystals from primitive Clear Lake Volcanic Field samples. The labeled colored dots on the crystals show the locations where they were analyzed with an electron microprobe for geochemical information. Figure by Dawnika Blatter.

Back-scattered electron images of olivine and chromium spinel crystals from primitive Clear Lake Volcanic Field samples. The labeled colored dots on the crystals show the locations where they were analyzed with an electron microprobe for geochemical information. Figure by Dawnika Blatter.

A geologist wearing an orange cap, blue shirt, and work gloves holds a rock and a large sledgehammer. He is standing in a brushy clearing amid large gray boulders. Behind him, a steep rounded hill is scattered with similar boulders and topped by a thick lava flow covered in spindly trees and sagebrush.
Sampling primitive older lavas in the Clear Lake Volcanic Field

USGS CalVO Research Geologist Seth Burgess collecting a sample of old, primitive lava in the Clear Lake Volcanic Field for geochemical analysis. USGS photo by Dawnika Blatter.

A row of 5 spectrograms show time on the horizontal and frequency on the vertical. Earthquakes are visible as bright colors.
Spectrogram of Mammoth Mountain earthquake swarm, November 28, 2024

These spectrograms of seismic stations near Long Valley's Mammoth Mountain show the brightly-colored punctuated spasms of small earthquakes happening within a 10 minute period.

These spectrograms of seismic stations near Long Valley's Mammoth Mountain show the brightly-colored punctuated spasms of small earthquakes happening within a 10 minute period.

A small outcropping of rough gray boulders sits in the middle of a field of dry, tan-colored grass. A metal clipboard leans on one rock to provide scale, and a low hill with a stand of oak trees is visible in the background.
Vitrophyre breccia in the Tolay Volcanic Field

This exposure of volcanic breccia is a volcanic rock comprised of broken pieces of vitrophyre, a welded volcanic glass. The breccia is found in the Tolay Volcanics, a sequence of rhyolite, andesite, and basalt at least 1220 m thick. The 9 Ma Tolay Volcanics are equivalent to the Berkeley Hills Volcanics. Photo courtesy of Ross Wagner.

This exposure of volcanic breccia is a volcanic rock comprised of broken pieces of vitrophyre, a welded volcanic glass. The breccia is found in the Tolay Volcanics, a sequence of rhyolite, andesite, and basalt at least 1220 m thick. The 9 Ma Tolay Volcanics are equivalent to the Berkeley Hills Volcanics. Photo courtesy of Ross Wagner.

A small outcropping of rough gray boulders sits in the middle of a field of dry, tan-colored grass. A metal clipboard leans on one rock to provide scale, and a low hill with a stand of oak trees is visible in the background.
Burdell Mountain andesite lava flow

The Burdell Mountain volcanics are flow-banded porphyritic andesite, volcanic breccia, volcanic mudflow deposits, and minor flow-banded dacite which can be found west of the Petaluma Valley. Dated at about 11 million years old, they are related to the Quien Sabe Volcanics to the southeast and were displaced by the Hayward-Calaveras fault system.

The Burdell Mountain volcanics are flow-banded porphyritic andesite, volcanic breccia, volcanic mudflow deposits, and minor flow-banded dacite which can be found west of the Petaluma Valley. Dated at about 11 million years old, they are related to the Quien Sabe Volcanics to the southeast and were displaced by the Hayward-Calaveras fault system.

Viewed from a rocky ledge, a brown-and-green grassy valley filled with eroded, rolling hills slopes towards a body of water at the lower right. Behind them, more hills covered in oak trees and a line of distant mountains form the horizon.
Quien Sabe Volcanic Field

A view of the southern Quien Sabe Range from high on Basalt Hill in Merced County. The Quien Sabe range is comprised of igneous intrusions, from >9 Ma to >11 Ma, predecessors to the volcanics of the Berkeley Hills and the southeastern equivalent of the Burdell Mountain lavas near Petaluma. Photo courtesy of Stephen W. Edwards

A view of the southern Quien Sabe Range from high on Basalt Hill in Merced County. The Quien Sabe range is comprised of igneous intrusions, from >9 Ma to >11 Ma, predecessors to the volcanics of the Berkeley Hills and the southeastern equivalent of the Burdell Mountain lavas near Petaluma. Photo courtesy of Stephen W. Edwards

Was this page helpful?