
Landsat Supporting Greater International Water Security
Looking to the past to protect the future: Landsat products and tools informing water security initiatives around the world. This is the second in a series of four articles showcasing the socio-economic benefits of Digital Earth Africa and Australia products and services, through user case studies and impact stories.
Access to safe water, sanitation and hygiene is a basic human right for health and wellbeing. The UN 2030 Agenda for Sustainable Development Goals (SDG 6) highlights the global need for clean water and sanitation for all. According to UNICEF, decades of misuse, unsustainable management practices, over extraction and the contamination of freshwater supplies has led to water stress in many countries, where demand for safe, usable water exceeds the available supply.
Across Australia and Africa, water security is being impacted by the increasing prevalence and severity of droughts, floods, and extreme weather events. Shifting climate patterns can cause unseasonable rainfall leading to flooding that impacts local infrastructure, drinking water and sanitation facilities.
Australian innovators are playing an important role in developing Earth observation initiatives that help to better understand water stress. They are working with Landsat imagery and data to contribute towards solutions that address water security concerns nationally, as well as in Africa.
Specifically, Digital Earth Australia (DEA) has developed innovative Earth observation products and tools to help understand and analyze surface water within Australia.
Digital Earth Australia Water Observations (DEA Water Observations) and Digital Earth Australia Waterbodies (DEA Waterbodies) employ Landsat satellite imagery to help users understand inland water distribution. By observing water across Australia since 1988, users can understand both short- and long-term patterns of water availability due to seasonal variations, extreme climate events such as droughts and floods, and longer-term changes in climate. This innovation has been shared across the world with the DEA Water Observation methodology in use in Colombia, South America, and across the African continent.
Using DEA Water Observations, we can see the differences in surface water between dry and wet years for Australia’s largest salt lake, Kati Thanda–Lake Eyre in South Australia. The left image from 2018 is a summary of the percentage of satellite observations over the year in which water was detected by the Landsat satellites, and the right image is from 2011, a much wetter year.

Helping to Improve the Use of Surface Water
Murray-Darling Basin, Australia
DEA Water Observations and DEA Waterbodies have been used by the Murray-Darling Basin Authority (MDBA) and the New South Wales Government Department Natural Resources Access Regulator (NRAR) to help map over 90,000 bodies of water and on-farm water storages across New South Wales. Using these products and tools has assisted policy makers in understanding water availability across the state, informed management practices, policy implementation, guided compliance, and supported evidence-based decision-making for organizations, communities and businesses in the Murray-Darling Basin. As a result of targeted partnerships with MDBA and Geoscience Australia in 2020, NRAR was able to raise New South Wales’s capacity to monitor on-farm storage units by almost 500 percent.
Digital Earth Africa Water Observations (DE Africa Water Observations) and the soon to be released Digital Earth Africa Waterbodies (DE Africa Waterbodies) have been developed using the DEA products as a guide. DE Africa Water Observations provides continental coverage to identify patterns of water availability at a local, regional, and country level. Governments, decision makers and researchers are using the product to help inform the development of local policy and to highlight the necessity for sustainable water management practices for critical water supplies in local communities. The product is also being used to map flooding events and understand the impact of human interventions, such as dams, on downstream water supplies.
Earth observation informing local decision making, conservation and water resource management
Lake Ngami – Okavango Delta, Botswana, Africa
The University of Botswana, led by Dr Kelebogile Mfundisi, has been using the DE Africa Water Observations products and tools to understand the seasonal changes in water extent of Lake Ngami, in the Okavango Delta. Dr Mfundisi mapped how drought resulted in exceptionally low levels of water in the lake during 2019, and how the lake disappeared completely from late 2019 through to late 2021. These results are critical in demonstrating the need for more sustainable management of the whole delta, helping to engage local policy makers and stakeholders including the Government of Botswana, Universities in Southern Africa Development Community and civil society.
“Let us make the Africa we want as we join efforts in the conservation of the Okavango watershed, leave no one behind.” Dr Kelebogile Mfundisi
Learn more about the research of Dr. Mfundisi here.

Lake Baringo – Ruko Conservancy, Kenya, Africa
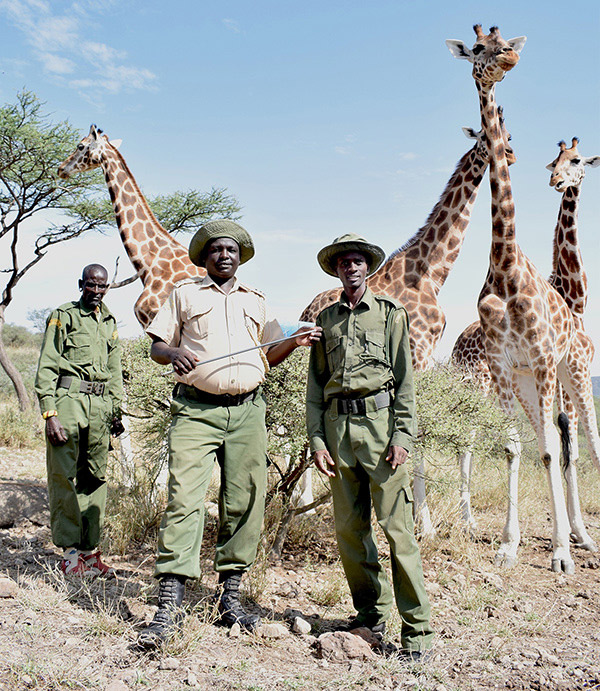
Following increased rainfall in Lake Baringo, flooding caused a family of highly-endangered Rothschild Giraffes to become marooned on an island in the lake. Combining the use of Earth observation data with the local knowledge of the communities and conservancy experts, it was recognized that the island was steadily shrinking and the giraffes would soon run out of space. Using satellite imagery from the DE Africa Water Observations to analyze patterns of water presence, a new habitat was identified for the giraffes and, over the course of months, they were moved by raft to a safe location on the shores of the lake. Research is ongoing into how the varying extent of Lake Baringo might further impact upon the local environment.
Planning for the future
Our changing climate has seen an increase in extreme weather events that can severely impact water security. Using Earth observation data and products such as DEA Water Observations, DEA Waterbodies, and DE Africa Water Observations, decision makers, researchers and industry can better understand the effects of increased rainfall or a severe drought. These insights can then help them make better informed decisions to prevent risk to communities and critical infrastructure.
How to get involved
More information about the Digital Earth Australia and Digital Earth Africa programs can be found via their websites.
Digital Earth Australia - https://www.dea.ga.gov.au/
Digital Earth Africa - https://www.digitalearthafrica.org/
For map-based access to DEA Water Observations, DE Africa Water Observations, DEA Water Bodies, DE Africa Water Bodies, as well as many other Landsat-based services, check out Digital Earth Australia Maps and Digital Earth Africa Map.
All DE Australia and DE Africa services can also be accessed through the free learning and analysis environments provided by the DEA and DE Africa Sandboxes. The Sandboxes include sample data and Jupyter Notebooks that allow you to experiment with DEA’s and DE Africa’s Earth observation datasets and explore proof-of-concept applications.
Visit app.sandbox.dea.ga.gov.au or sandbox.digitalearth.africa/ to sign up for a new account.
About Landsat
Since 1972, Landsat satellites have continuously acquired images of the Earth’s land surfaces, surface waters, and coastal regions, providing uninterrupted data to help land managers and policymakers make informed decisions about natural resources and the environment. The mission is jointly managed by the USGS and NASA. Data acquired by Landsat satellites are distributed from the USGS Earth Resources Observation and Science (EROS) Center in Sioux Falls, South Dakota.
Learn more about Landsat at https://www.usgs.gov/landsat and https://landsat.gsfc.nasa.gov/
Learn more about Landsat Products at https://www.usgs.gov/landsat-missions/landsat-science-products
Return to all Landsat Headlines