
The USGS Landsat archive holds over fifty years of Earth-Observing satellite data. This animation displays the cumulative number of Landsat scenes since 1972. The colors on the maps show the density of the number of Landsat Level-1 products.
Michelle Bouchard (Former Employee)
Science and Products
Filter Total Items: 66
Eyes on Earth Episode 137 – Landsat Takes Yellowstone’s Temperature
How do you keep track of thousands of hot spots in an area the size of Yellowstone National Park? Check out thermal satellite data like Landsat’s!

Eyes on Earth Episode 136 – The EROS Test Site
The same as the Landsat satellite, only smaller—that’s a fair description of the field spectrometer used at the EROS test site for validating Landsat’s accuracy.

Eyes on Earth Episode 135 – Exotic Annual Grasses and Sheep Grazing
Invasive grasses are degrading sagebrush in western states. Can sheep help us restore these ecosystems?

Eyes on Earth Episode 134 – Data Accuracy: The Calibration and Validation of Landsat
Researchers and other satellite programs rely on the scientifically correct data from Landsat—every pixel and every spectral band that is measured.

Eyes on Earth Episode 133 – Vietnam War Bomb Craters
No longer used for spying, declassified spy satellite imagery is finding fascinating new uses.

Eyes on Earth Episode 132 – Moving Forward with AI at EROS
Artificial intelligence (AI) is helping to make the science work at EROS better and more efficient, as we continue to develop valuable data products.

Eyes on Earth Episode 131 – Using AI in Geospatial Work
Artificial intelligence (AI) is helping to make EROS data products better and more efficient.

Eyes on Earth Episode 130 – NLCD Accuracy
Providing accuracy metrics for a land cover map takes some work. But there’s poetry and story involved, too.

Eyes on Earth Episode 129 – What Happens During a Landsat Pass?
For this episode, we go inside the Landsat operations room at EROS to see what happens during a live Landsat pass.

Eyes on Earth Episode 128 – 2024 EROS Fall Poster Session
Posters covered a wide range of topics as local graduate students and EROS scientists shared their work in the EROS atrium.

Eyes on Earth Episode 127 – The Historic Landsat 7 Mission
Taking care of a satellite that’s 438 miles in space requires creative problem solving—we talk about those moments and memories of the nearly 25 years of land imaging from Landsat 7.

Eyes on Earth Episode 126 – Annual NLCD
The next generation of USGS land cover mapping is here. Annual NLCD provides land cover data of the U.S. every year back to 1985.

Landsat 8 Image of Lake St. Clair
Landsat captured the tug of war between winter and spring on the heart-shaped Lake St. Clair along the U.S./Canadian border near Detroit. This Landsat 8 image was acquired on March 6, 2021 and is shown as a natural color composite. Learn more about the Landsat program at www.usgs.gov/landsat
Filter Total Items: 29
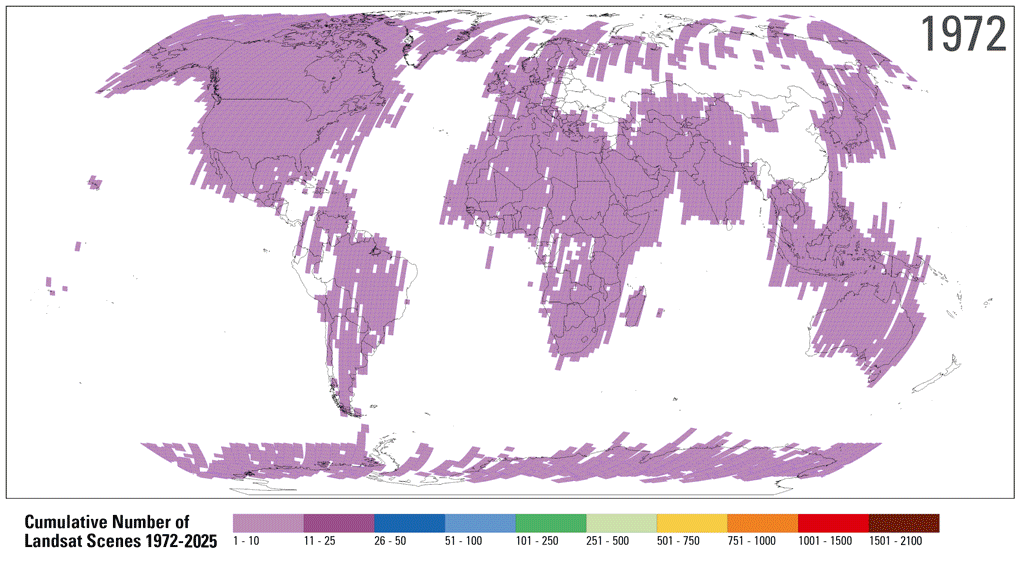
Cumulative Number of Landsat Scenes
The USGS Landsat archive holds over fifty years of Earth-Observing satellite data. This animation displays the cumulative number of Landsat scenes since 1972. The colors on the maps show the density of the number of Landsat Level-1 products.
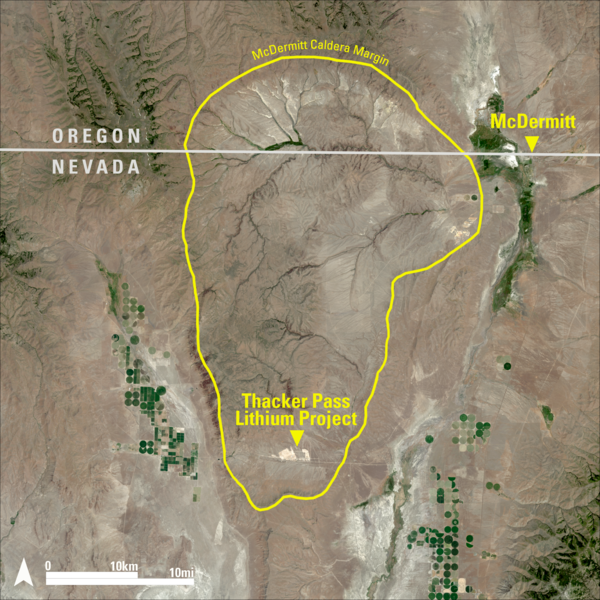
Landsat 8 Image of Thacker Pass
This Landsat 8 image highlights the McDermitt Caldera, which straddles the Nevada–Oregon border. The yellow boundary outlines the caldera margin, a geologic feature formed by a massive volcanic eruption millions of years ago. Over time, weathering of lithium-rich volcanic material led to the formation of clay deposits within the caldera basin.
This Landsat 8 image highlights the McDermitt Caldera, which straddles the Nevada–Oregon border. The yellow boundary outlines the caldera margin, a geologic feature formed by a massive volcanic eruption millions of years ago. Over time, weathering of lithium-rich volcanic material led to the formation of clay deposits within the caldera basin.

Landsat 9 Sees Diverse Landscapes of the Desert Southwest
Landsat 9 Sees Diverse Landscapes of the Desert SouthwestThe USGS EROS Landsat archive recently reached a milestone of 12 million Landsat Collection 2 Level-1 products. These are available for download at no charge. The image representing this milestone displays a sprawling desert landscape and contains a multitude of agricultural, geological, and urban features.

The Eye of Quebec, 1964/2024
A large, round lake in Quebec, Canada, highlights the geography of an ancient impact crater. In the late Triassic Period, a 3 mile wide meteorite struck northern Pangea at over 30,000 miles per hour. The resulting crater is now 214 million years old, but the dramatic circular lake visible in 2024 Landsat imagery is a surprisingly recent feature.
A large, round lake in Quebec, Canada, highlights the geography of an ancient impact crater. In the late Triassic Period, a 3 mile wide meteorite struck northern Pangea at over 30,000 miles per hour. The resulting crater is now 214 million years old, but the dramatic circular lake visible in 2024 Landsat imagery is a surprisingly recent feature.
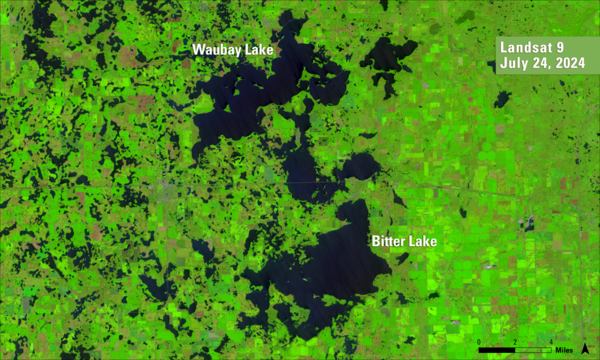
2024 Landsat 9 image of Day County, SD
A false color Landsat 8 image from July 24, 2024, of Waubay Lake and Bitter Lake in Day County, South Dakota.
A false color Landsat 8 image from July 24, 2024, of Waubay Lake and Bitter Lake in Day County, South Dakota.

Landsat 9 View of Beaufort Sea Melt Ponds
This Landsat 9 image from June 13, 2024, shows the Beaufort Sea near Prudhoe Bay, Alaska, using the Shortwave Infrared, Near Infrared, and Reds (Band 6|5|4), and sharpened with the with Panchromatic band (Band 8). The cyan tones highlight sea ice and melt ponds, while the red areas represent land and vegetation.
This Landsat 9 image from June 13, 2024, shows the Beaufort Sea near Prudhoe Bay, Alaska, using the Shortwave Infrared, Near Infrared, and Reds (Band 6|5|4), and sharpened with the with Panchromatic band (Band 8). The cyan tones highlight sea ice and melt ponds, while the red areas represent land and vegetation.
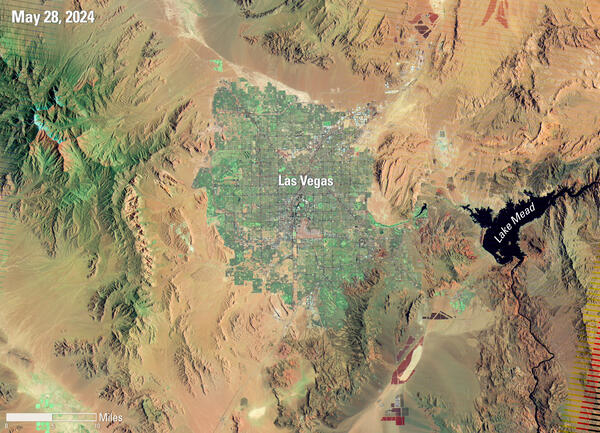
Las Vegas Through Landsat 7’s Eyes
These Landsat 7 images showcase the first and last captures of the Las Vegas area, taken on July 4, 1999, and May 28, 2024, respectively. The images highlight the city, the surrounding desert landscape, and Lake Mead, using shortwave infrared (SWIR), near-infrared (NIR), and red bands to emphasize differences in vegetation, water, and urban growth.
These Landsat 7 images showcase the first and last captures of the Las Vegas area, taken on July 4, 1999, and May 28, 2024, respectively. The images highlight the city, the surrounding desert landscape, and Lake Mead, using shortwave infrared (SWIR), near-infrared (NIR), and red bands to emphasize differences in vegetation, water, and urban growth.
EROS 50th Anniversary poster
This is the commemorative poster for the 50th anniversary celebration, in 2023, of the USGS Earth Resources Observation and Science (EROS) Center in South Dakota.
This is the commemorative poster for the 50th anniversary celebration, in 2023, of the USGS Earth Resources Observation and Science (EROS) Center in South Dakota.

Increases in U.S. Analysis Ready Data Tiles with Collection 2
Increases in U.S. Analysis Ready Data Tiles with Collection 2This graphic shows additional tiles available for Collection 2 U.S. Analysis Ready Data (ARD) when compared to Collection 1 U.S. ARD for the same period (1982-2021).
Increases in U.S. Analysis Ready Data Tiles with Collection 2
Increases in U.S. Analysis Ready Data Tiles with Collection 2This graphic shows additional tiles available for Collection 2 U.S. Analysis Ready Data (ARD) when compared to Collection 1 U.S. ARD for the same period (1982-2021).

Before and After Landsat 8/9 images Showing Impacts of Recent Storm Events
Before and After Landsat 8/9 images Showing Impacts of Recent Storm EventsThe state of California has experienced record-breaking rainfall since December. The impacts of these recent storms can be seen from space.
Landsat 8/9 captured these natural color (Bands 4|3|2) before and after images of Northern California showing turbid rivers, rising reservoirs, and saturated fields.

Landsat 9 Captures Hurricane Ian Aftermath (New Smyrna Beach, FL)
Landsat 9 Captures Hurricane Ian Aftermath (New Smyrna Beach, FL)Landsat 9 captured this image of the aftermath of Hurricane Ian in eastern Florida on the morning of October 6, 2022. It shows the coast and New Smyrna Beach, which experienced extensive flooding.

Landsat 7 Captures Hurricane Ian Aftermath (Sanibel Island)
Landsat 7 Captures Hurricane Ian Aftermath (Sanibel Island)Landsat 7 captured this image of the aftermath of Hurricane Ian in southwestern Florida, including floodwater and sediment in the ocean, on the morning of October 2, 2022. Sanibel Island is shown at the center with Fort Myers Beach and Cape Coral to the right. Naples is the gray urban area in the lower right.

Landsat 9 Image of Aorounga Crater
The Aorounga Crater located in Chad, Africa is a large impact crater that appears as a circular depression surrounded by a raised rim, as seen in this Landsat 9 image. The crater is surrounded by a vast expanse of desert and is known for its unique rock ridges, known as yardangs.
The Aorounga Crater located in Chad, Africa is a large impact crater that appears as a circular depression surrounded by a raised rim, as seen in this Landsat 9 image. The crater is surrounded by a vast expanse of desert and is known for its unique rock ridges, known as yardangs.

Landsat Records 50 Years of Growth in Dallas-Fort Worth
Landsat Records 50 Years of Growth in Dallas-Fort WorthLandsat 1 celebrated its 50th anniversary on July 23, 2022!
Landsat 1's first satellite image shared with the world was a view of Dallas-Fort Worth, Texas. Over the course of five decades, Landsat satellites have captured the Dallas-Fort Worth area 2033 times, compiled into individual scenes in the Landsat Archive.

Example of the Landsat Collection 2 Provisional Evapotranspiration science product
Example of the Landsat Collection 2 Provisional Evapotranspiration science productExample of the Landsat Collection 2 Provisional Evapotranspiration science product for agricultural fields on the Fucino plain near San Benedetto dei Marsi, Italy. Left: Landsat 9 Collection 2 Natural Color Surface Reflectance Image. Right: Landsat 9 Collection 2 Actual Evapotranspiration Image.

Great Salt Lake comparison, 1986 and 2022
These Landsat images show the lake at record high levels in 1986 and at a historic low elevation on July 3, 2022.
These Landsat images show the lake at record high levels in 1986 and at a historic low elevation on July 3, 2022.
Great Salt Lake comparison, 1986 and 2022
These Landsat images show the lake at record high levels in 1986 and at a historic low elevation on July 3, 2022.
These Landsat images show the lake at record high levels in 1986 and at a historic low elevation on July 3, 2022.

Landsat 7 First Light Image of Eastern South Dakota
Landsat 7 First Light Image of Eastern South DakotaThis color infrared image of Southeast South Dakota and Northeast Nebraska was advertised as the first image acquired by Landsat 7's Enhanced Thematic Mapper Plus (ETM+) sensor on April 18, 1999.
Landsat 7 First Light Image of Eastern South Dakota
Landsat 7 First Light Image of Eastern South DakotaThis color infrared image of Southeast South Dakota and Northeast Nebraska was advertised as the first image acquired by Landsat 7's Enhanced Thematic Mapper Plus (ETM+) sensor on April 18, 1999.

Landsat 9 image of Northern Madagascar
The Betsiboka River in Northern Madagascar is seen in this Landsat 9 natural color image from December 7, 2021. Extensive logging has left the land vulnerable, and iron rich soils are washed into the river, coloring it a reddish orange as it flows to the Betsiboka estuary delta.
Product ID LC09_L1TP_160071_20211207_20220120_02_T1

Landsat 9 Underfly with Landsat 8 over Puerto Vallarta, Mexico
Landsat 9 Underfly with Landsat 8 over Puerto Vallarta, MexicoImages from the Landsat 9 underfly with Landsat 8 over Puerto Vallarta, Mexico on November 11, 2021. The left image shows the Landsat 8 OLI image and the right image is from Landsat 9 OLI. Both images are shown as a true color image using the red, green, and blue bands (Bands 4,3,2).
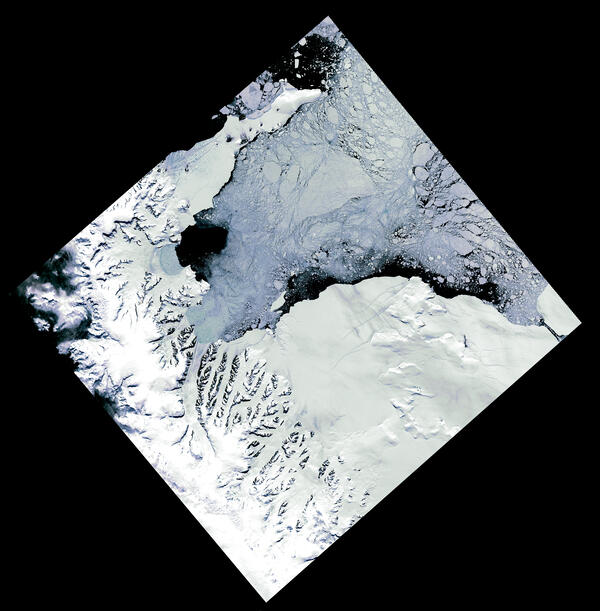
Landsat image of the Larsen B Ice Shelf after its collapse
Landsat image of the Larsen B Ice Shelf after its collapseThis natural color pan sharpened Landsat 7 image from December 18, 2002 shows the remnant or the Larsen B ice shelf after its collapse at the beginning of the year. Landsat’s detailed observations help scientists track changes in ice stability over time.
Science and Products
Filter Total Items: 66
Eyes on Earth Episode 137 – Landsat Takes Yellowstone’s Temperature
How do you keep track of thousands of hot spots in an area the size of Yellowstone National Park? Check out thermal satellite data like Landsat’s!
Eyes on Earth Episode 136 – The EROS Test Site
The same as the Landsat satellite, only smaller—that’s a fair description of the field spectrometer used at the EROS test site for validating Landsat’s accuracy.
Eyes on Earth Episode 135 – Exotic Annual Grasses and Sheep Grazing
Invasive grasses are degrading sagebrush in western states. Can sheep help us restore these ecosystems?
Eyes on Earth Episode 134 – Data Accuracy: The Calibration and Validation of Landsat
Researchers and other satellite programs rely on the scientifically correct data from Landsat—every pixel and every spectral band that is measured.
Eyes on Earth Episode 133 – Vietnam War Bomb Craters
No longer used for spying, declassified spy satellite imagery is finding fascinating new uses.
Eyes on Earth Episode 132 – Moving Forward with AI at EROS
Artificial intelligence (AI) is helping to make the science work at EROS better and more efficient, as we continue to develop valuable data products.
Eyes on Earth Episode 131 – Using AI in Geospatial Work
Artificial intelligence (AI) is helping to make EROS data products better and more efficient.
Eyes on Earth Episode 130 – NLCD Accuracy
Providing accuracy metrics for a land cover map takes some work. But there’s poetry and story involved, too.
Eyes on Earth Episode 129 – What Happens During a Landsat Pass?
For this episode, we go inside the Landsat operations room at EROS to see what happens during a live Landsat pass.
Eyes on Earth Episode 128 – 2024 EROS Fall Poster Session
Posters covered a wide range of topics as local graduate students and EROS scientists shared their work in the EROS atrium.
Eyes on Earth Episode 127 – The Historic Landsat 7 Mission
Taking care of a satellite that’s 438 miles in space requires creative problem solving—we talk about those moments and memories of the nearly 25 years of land imaging from Landsat 7.
Eyes on Earth Episode 126 – Annual NLCD
The next generation of USGS land cover mapping is here. Annual NLCD provides land cover data of the U.S. every year back to 1985.
Landsat 8 Image of Lake St. Clair
Landsat captured the tug of war between winter and spring on the heart-shaped Lake St. Clair along the U.S./Canadian border near Detroit. This Landsat 8 image was acquired on March 6, 2021 and is shown as a natural color composite. Learn more about the Landsat program at www.usgs.gov/landsat
Filter Total Items: 29
Cumulative Number of Landsat Scenes
The USGS Landsat archive holds over fifty years of Earth-Observing satellite data. This animation displays the cumulative number of Landsat scenes since 1972. The colors on the maps show the density of the number of Landsat Level-1 products.
The USGS Landsat archive holds over fifty years of Earth-Observing satellite data. This animation displays the cumulative number of Landsat scenes since 1972. The colors on the maps show the density of the number of Landsat Level-1 products.
Landsat 8 Image of Thacker Pass
This Landsat 8 image highlights the McDermitt Caldera, which straddles the Nevada–Oregon border. The yellow boundary outlines the caldera margin, a geologic feature formed by a massive volcanic eruption millions of years ago. Over time, weathering of lithium-rich volcanic material led to the formation of clay deposits within the caldera basin.
This Landsat 8 image highlights the McDermitt Caldera, which straddles the Nevada–Oregon border. The yellow boundary outlines the caldera margin, a geologic feature formed by a massive volcanic eruption millions of years ago. Over time, weathering of lithium-rich volcanic material led to the formation of clay deposits within the caldera basin.
Landsat 9 Sees Diverse Landscapes of the Desert Southwest
Landsat 9 Sees Diverse Landscapes of the Desert SouthwestThe USGS EROS Landsat archive recently reached a milestone of 12 million Landsat Collection 2 Level-1 products. These are available for download at no charge. The image representing this milestone displays a sprawling desert landscape and contains a multitude of agricultural, geological, and urban features.
The Eye of Quebec, 1964/2024
A large, round lake in Quebec, Canada, highlights the geography of an ancient impact crater. In the late Triassic Period, a 3 mile wide meteorite struck northern Pangea at over 30,000 miles per hour. The resulting crater is now 214 million years old, but the dramatic circular lake visible in 2024 Landsat imagery is a surprisingly recent feature.
A large, round lake in Quebec, Canada, highlights the geography of an ancient impact crater. In the late Triassic Period, a 3 mile wide meteorite struck northern Pangea at over 30,000 miles per hour. The resulting crater is now 214 million years old, but the dramatic circular lake visible in 2024 Landsat imagery is a surprisingly recent feature.
2024 Landsat 9 image of Day County, SD
A false color Landsat 8 image from July 24, 2024, of Waubay Lake and Bitter Lake in Day County, South Dakota.
A false color Landsat 8 image from July 24, 2024, of Waubay Lake and Bitter Lake in Day County, South Dakota.
Landsat 9 View of Beaufort Sea Melt Ponds
This Landsat 9 image from June 13, 2024, shows the Beaufort Sea near Prudhoe Bay, Alaska, using the Shortwave Infrared, Near Infrared, and Reds (Band 6|5|4), and sharpened with the with Panchromatic band (Band 8). The cyan tones highlight sea ice and melt ponds, while the red areas represent land and vegetation.
This Landsat 9 image from June 13, 2024, shows the Beaufort Sea near Prudhoe Bay, Alaska, using the Shortwave Infrared, Near Infrared, and Reds (Band 6|5|4), and sharpened with the with Panchromatic band (Band 8). The cyan tones highlight sea ice and melt ponds, while the red areas represent land and vegetation.
Las Vegas Through Landsat 7’s Eyes
These Landsat 7 images showcase the first and last captures of the Las Vegas area, taken on July 4, 1999, and May 28, 2024, respectively. The images highlight the city, the surrounding desert landscape, and Lake Mead, using shortwave infrared (SWIR), near-infrared (NIR), and red bands to emphasize differences in vegetation, water, and urban growth.
These Landsat 7 images showcase the first and last captures of the Las Vegas area, taken on July 4, 1999, and May 28, 2024, respectively. The images highlight the city, the surrounding desert landscape, and Lake Mead, using shortwave infrared (SWIR), near-infrared (NIR), and red bands to emphasize differences in vegetation, water, and urban growth.
EROS 50th Anniversary poster
This is the commemorative poster for the 50th anniversary celebration, in 2023, of the USGS Earth Resources Observation and Science (EROS) Center in South Dakota.
This is the commemorative poster for the 50th anniversary celebration, in 2023, of the USGS Earth Resources Observation and Science (EROS) Center in South Dakota.
Increases in U.S. Analysis Ready Data Tiles with Collection 2
Increases in U.S. Analysis Ready Data Tiles with Collection 2This graphic shows additional tiles available for Collection 2 U.S. Analysis Ready Data (ARD) when compared to Collection 1 U.S. ARD for the same period (1982-2021).
Increases in U.S. Analysis Ready Data Tiles with Collection 2
Increases in U.S. Analysis Ready Data Tiles with Collection 2This graphic shows additional tiles available for Collection 2 U.S. Analysis Ready Data (ARD) when compared to Collection 1 U.S. ARD for the same period (1982-2021).
Before and After Landsat 8/9 images Showing Impacts of Recent Storm Events
Before and After Landsat 8/9 images Showing Impacts of Recent Storm EventsThe state of California has experienced record-breaking rainfall since December. The impacts of these recent storms can be seen from space.
Landsat 8/9 captured these natural color (Bands 4|3|2) before and after images of Northern California showing turbid rivers, rising reservoirs, and saturated fields.
Landsat 9 Captures Hurricane Ian Aftermath (New Smyrna Beach, FL)
Landsat 9 Captures Hurricane Ian Aftermath (New Smyrna Beach, FL)Landsat 9 captured this image of the aftermath of Hurricane Ian in eastern Florida on the morning of October 6, 2022. It shows the coast and New Smyrna Beach, which experienced extensive flooding.
Landsat 7 Captures Hurricane Ian Aftermath (Sanibel Island)
Landsat 7 Captures Hurricane Ian Aftermath (Sanibel Island)Landsat 7 captured this image of the aftermath of Hurricane Ian in southwestern Florida, including floodwater and sediment in the ocean, on the morning of October 2, 2022. Sanibel Island is shown at the center with Fort Myers Beach and Cape Coral to the right. Naples is the gray urban area in the lower right.
Landsat 9 Image of Aorounga Crater
The Aorounga Crater located in Chad, Africa is a large impact crater that appears as a circular depression surrounded by a raised rim, as seen in this Landsat 9 image. The crater is surrounded by a vast expanse of desert and is known for its unique rock ridges, known as yardangs.
The Aorounga Crater located in Chad, Africa is a large impact crater that appears as a circular depression surrounded by a raised rim, as seen in this Landsat 9 image. The crater is surrounded by a vast expanse of desert and is known for its unique rock ridges, known as yardangs.
Landsat Records 50 Years of Growth in Dallas-Fort Worth
Landsat Records 50 Years of Growth in Dallas-Fort WorthLandsat 1 celebrated its 50th anniversary on July 23, 2022!
Landsat 1's first satellite image shared with the world was a view of Dallas-Fort Worth, Texas. Over the course of five decades, Landsat satellites have captured the Dallas-Fort Worth area 2033 times, compiled into individual scenes in the Landsat Archive.
Example of the Landsat Collection 2 Provisional Evapotranspiration science product
Example of the Landsat Collection 2 Provisional Evapotranspiration science productExample of the Landsat Collection 2 Provisional Evapotranspiration science product for agricultural fields on the Fucino plain near San Benedetto dei Marsi, Italy. Left: Landsat 9 Collection 2 Natural Color Surface Reflectance Image. Right: Landsat 9 Collection 2 Actual Evapotranspiration Image.
Great Salt Lake comparison, 1986 and 2022
These Landsat images show the lake at record high levels in 1986 and at a historic low elevation on July 3, 2022.
These Landsat images show the lake at record high levels in 1986 and at a historic low elevation on July 3, 2022.
Great Salt Lake comparison, 1986 and 2022
These Landsat images show the lake at record high levels in 1986 and at a historic low elevation on July 3, 2022.
These Landsat images show the lake at record high levels in 1986 and at a historic low elevation on July 3, 2022.
Landsat 7 First Light Image of Eastern South Dakota
Landsat 7 First Light Image of Eastern South DakotaThis color infrared image of Southeast South Dakota and Northeast Nebraska was advertised as the first image acquired by Landsat 7's Enhanced Thematic Mapper Plus (ETM+) sensor on April 18, 1999.
Landsat 7 First Light Image of Eastern South Dakota
Landsat 7 First Light Image of Eastern South DakotaThis color infrared image of Southeast South Dakota and Northeast Nebraska was advertised as the first image acquired by Landsat 7's Enhanced Thematic Mapper Plus (ETM+) sensor on April 18, 1999.
Landsat 9 image of Northern Madagascar
The Betsiboka River in Northern Madagascar is seen in this Landsat 9 natural color image from December 7, 2021. Extensive logging has left the land vulnerable, and iron rich soils are washed into the river, coloring it a reddish orange as it flows to the Betsiboka estuary delta.
Product ID LC09_L1TP_160071_20211207_20220120_02_T1
The Betsiboka River in Northern Madagascar is seen in this Landsat 9 natural color image from December 7, 2021. Extensive logging has left the land vulnerable, and iron rich soils are washed into the river, coloring it a reddish orange as it flows to the Betsiboka estuary delta.
Product ID LC09_L1TP_160071_20211207_20220120_02_T1
Landsat 9 Underfly with Landsat 8 over Puerto Vallarta, Mexico
Landsat 9 Underfly with Landsat 8 over Puerto Vallarta, MexicoImages from the Landsat 9 underfly with Landsat 8 over Puerto Vallarta, Mexico on November 11, 2021. The left image shows the Landsat 8 OLI image and the right image is from Landsat 9 OLI. Both images are shown as a true color image using the red, green, and blue bands (Bands 4,3,2).
Landsat image of the Larsen B Ice Shelf after its collapse
Landsat image of the Larsen B Ice Shelf after its collapseThis natural color pan sharpened Landsat 7 image from December 18, 2002 shows the remnant or the Larsen B ice shelf after its collapse at the beginning of the year. Landsat’s detailed observations help scientists track changes in ice stability over time.