
Chloride in Snowy Urban Watersheds
By Upper Midwest Water Science Center
2014 (approx.)

Detailed Description
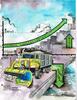
Chloride concentrations in these studied northern U.S. cities increased substantially over time with maximum concentrations occurring in the winter. This drawing shows a snowplow in an urban environment, it shows chloride entering the water directly from the roadway. In the background we see a graph of increasing chloride concentrations from 1980 to 2010 with respect to the U.S. E.P.A. Chronic Water Quality Criteria. The urban skyline mirrors the chloride increase with its own increasing urbanization as the buildings get taller and taller. This is an example of the unique and powerful ways art can depict data. An entire concept can be built into what would otherwise be a simple graph.
Illustration by Benjamin Siebers.
Sources/Usage
Public Domain.