
Earth Observing-1 (EO-1) Hyperion hyperspectral data

Detailed Description
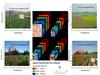
Figure 1: The Hyperion data were used to extract and illustrate spectral signatures of some of the leading world agricultural crops as illustrated in this figure. The image is of an area in the Ferghana Valley in Uzbekistan, Central Asia. The crops are irrigated. Hyperspectral data such as these can be used to develop hyperspectral libraries of agricultural crops and vegetation as well as in the study of their biophysical and biochemical quantities. (Thenkabail et al. 2013)
Sources/Usage
Courtesy: Prasad Thenkabail
Thenkabail, P.S., Mariotto, I., Gumma, M.K.,, Middleton, E.M., Landis, and D.R., Huemmrich, F.K., 2013. Selection of hyperspectral narrowbands (HNBs) and composition of hyperspectral twoband vegetation indices (HVIs) for biophysical characterization and discrimination of crop types using field reflectance and Hyperion/EO-1 data. IEEE JOURNAL OF SELECTED TOPICS IN APPLIED EARTH OBSERVATIONS AND REMOTE SENSING, Pp. 427-439, VOL. 6, NO. 2, APRIL 2013.doi: 10.1109/JSTARS.2013.2252601. (80%). IP-037139.
Related

Global Hyperspectral Imaging Spectral-library of Agricultural-Crops & Vegetation (GHISA)
Related