An official website of the United States government
Here's how you know
Official websites use .gov
A .gov website belongs to an official government organization in the United States.
Secure .gov websites use HTTPS
A lock () or https:// means you’ve safely connected to the .gov website. Share sensitive information only on official, secure websites.
This webpage showcases the key research advances made in hyperspectral remote sensing of agricultural crops and vegetation over the last 50 years. There are three focus areas:
Ongoing research in Global Hyperspectral Imaging Spectral-library of Agricultural-Crops (GHISA)
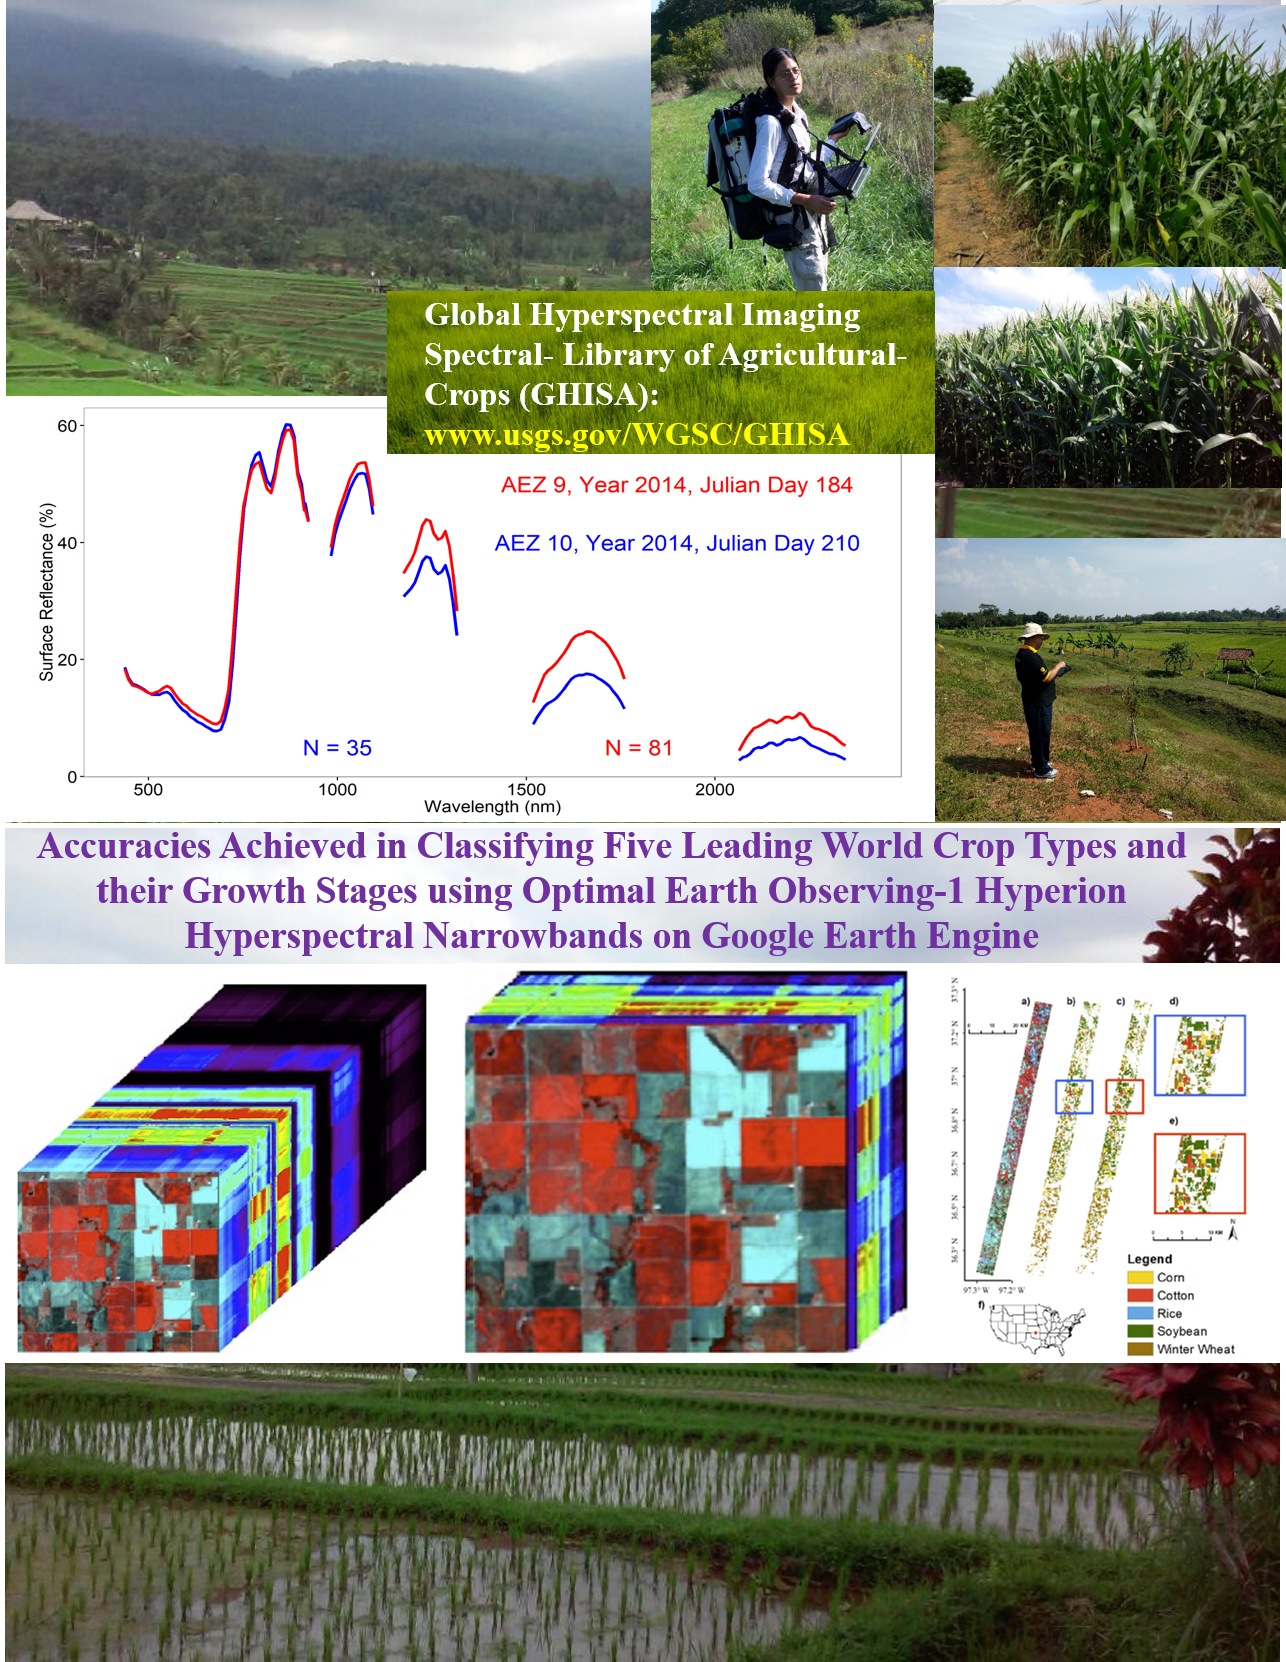
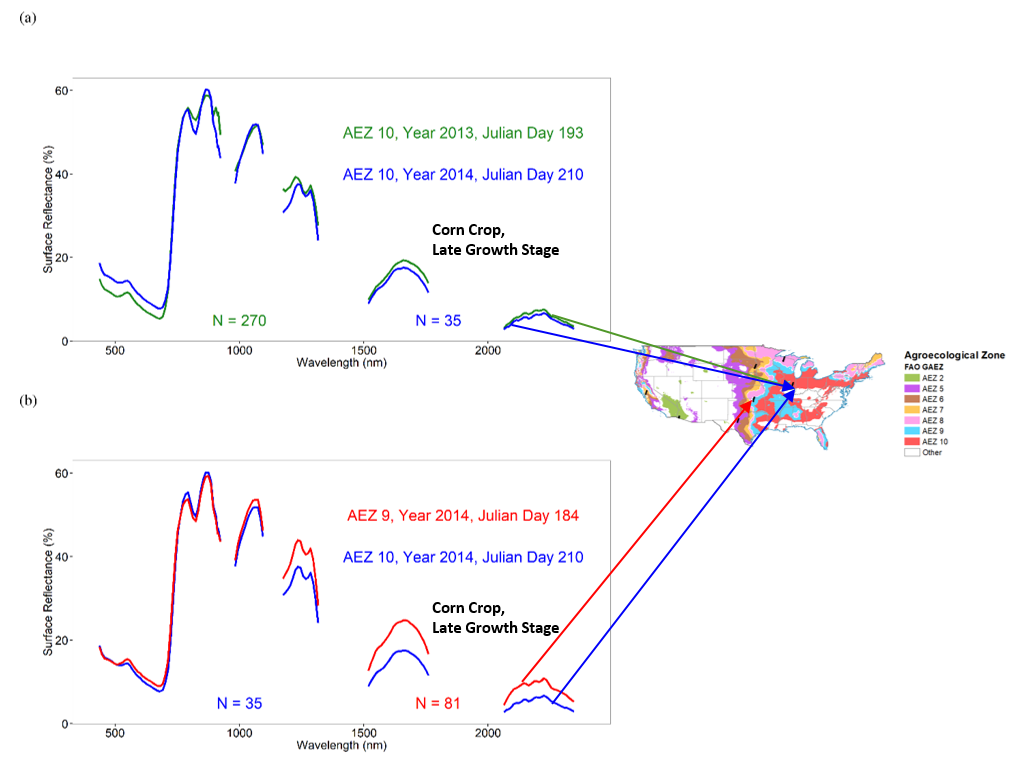
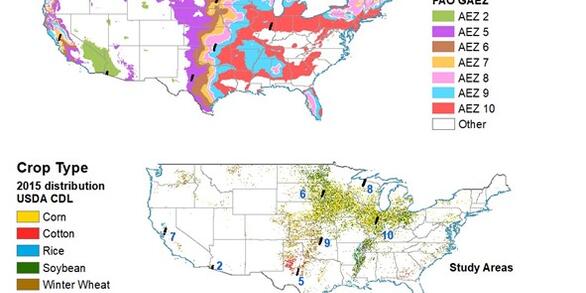
Hyperspectral Imaging Spectroscopy (HIS) provides the most advanced next-generation remote sensing data in the spectral domain in the form of spectral signatures for every pixel observed as opposed to data from a few spectral data points of the current generation of sensors (Figure A). This will help us advance our understanding of Planet Earth through more accurate and precise models, maps, and monitoring capabilities. Given, this importance, Dr. Itiya Aneece and Dr. Prasad Thenkabail of the United States Geological Survey (USGS) conduct a detailed study of five leading world agricultural crops (corn, soybean, winter wheat, rice, and cotton) that occupy 75% and 54% of principal crop areas in the United States and the world respectively using HIS data from Earth Observing-1 (EO-1) Hyperion data by utilizing 99 images spread across various agroecological zones (AEZs) of USA (Figure B). The study established optimal hyperspectral narrowbands (HNBs) to study agricultural crops, conducted dimension reduction studies through data mining approaches, and established accuracies and errors in classifying Hyperion images for crop type mapping using machine learning algorithms (e.g., Support Vector Machines) on the Google Earth Engine (GEE) cloud computing platform. The study will make a significant contribution to upcoming hyperspectral sensors such as the recently launched HysIS (Hyperspectral Imaging Satellite of India with 55 bands in 400-950 nm VNIR and 165 bands in 900-2500 nm SWIR) by India, and NASA’s Surface Biology and Geology (SBG) mission. This study built a novel, first-of-its-kind, global hyperspectral imaging spectral-library of agricultural crops (Figure A). For detailed descriptions of Hyperion image processing and compilation of GHISA, please refer to Chapter 9 on Hyperion preprocessing in this book, Google Earth Engine code, and the manuscript “Accuracies achieved in classifying five leading world crop types and their growth stages using optimal Earth Observing-1 Hyperion hyperspectral narrowbands on Google Earth Engine” published in the Remote Sensing open-access journal providing details of Global Hyperspectral Imaging Spectral-library of Agricultural-crops (GHISA). The GHISA derived hyperspectral library (example Figure B below) will be of immense value to understand, model, map, and monitor agricultural crops within and across agroecological zones (Figure B).
Research conducted over the last 20 years (by Dr. Prasad S. Thenkabail’s group)
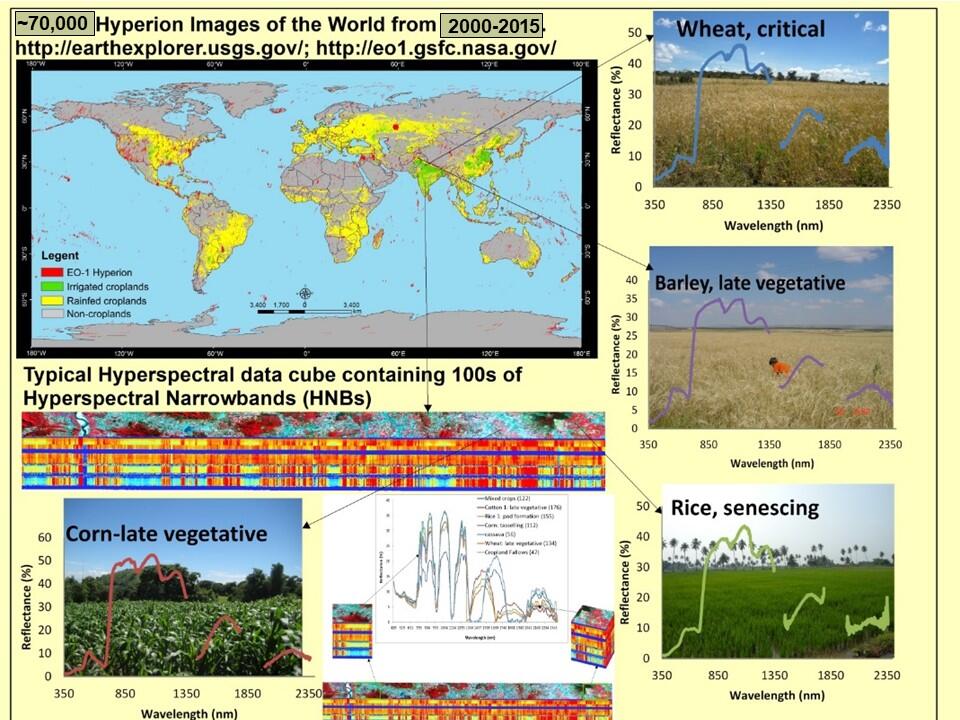
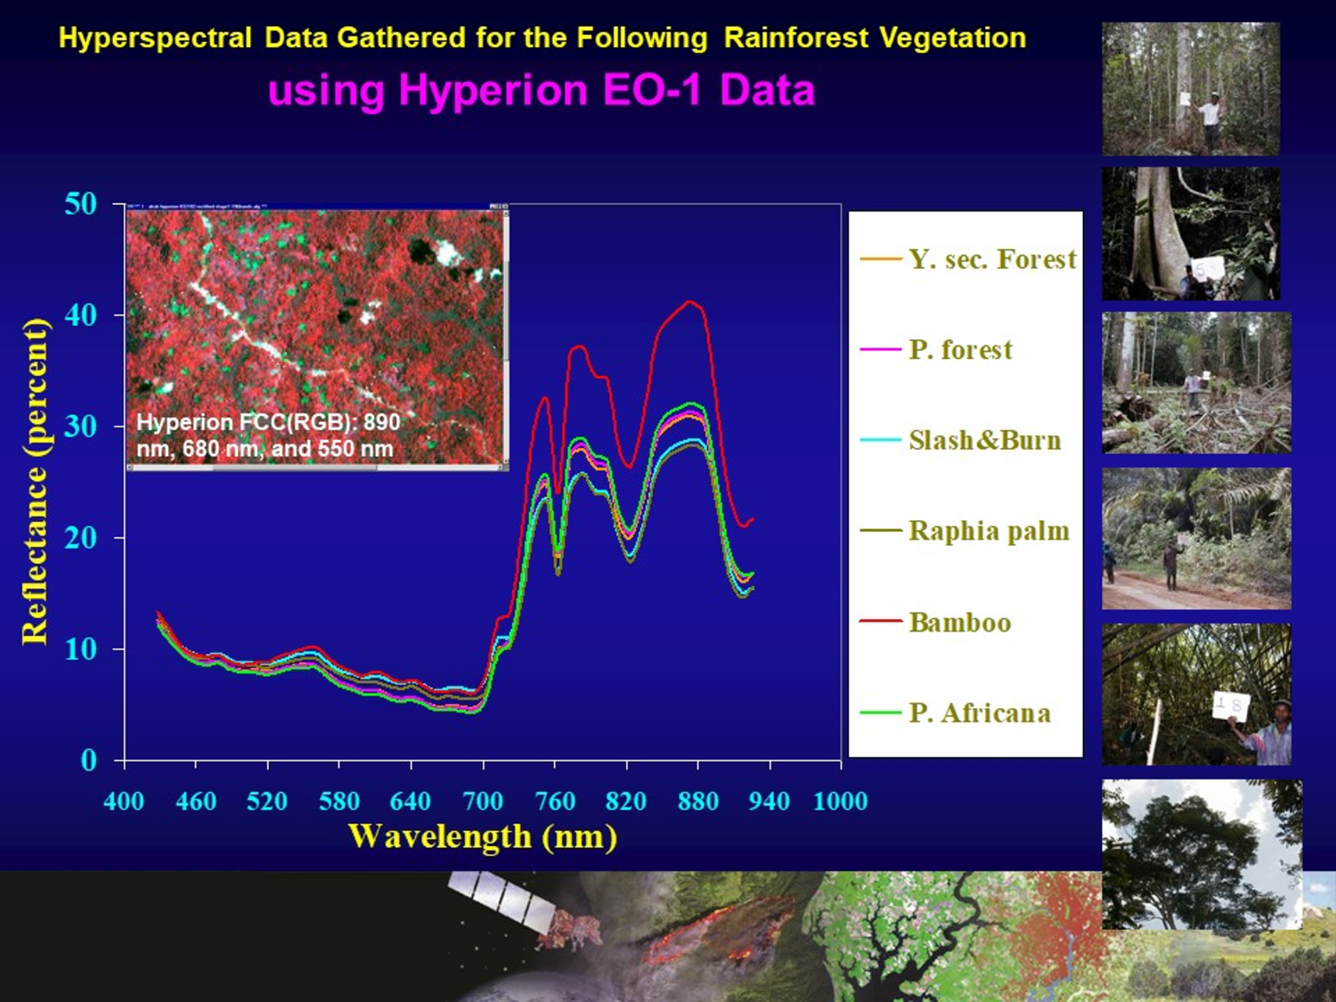
The primary focus is on the seminal research conducted over the last 20 years by this group using hyperspectral data of agricultural crops and vegetation, gathered from around the world, from various platforms: ground-based, platform-mounted, drone or unmanned aerial vehicle (UAV)-based, airborne, and spaceborne. The leading world crops studied include wheat, rice, corn, soybeans, barley, cotton, and alfalfa (Table 1). Natural vegetation in the African savannas and rainforests were also studied using hyperspectral (or imaging spectroscopy) data. For example, Figure 1 illustrates Earth Observing-1 (EO-1) Hyperion hyperspectral Data Cube from which agricultural crop spectral libraries are derived for some of the leading world crops. Figure 2 illustrates EO-1 Hyperion hyperspectral data cube for data acquired over African rainforests.
Table 1: Cropland Areas (Thenkabail et al., 2013; Monfreda et al., 2008)Source:Monfreda, C., N. Ramankutty, and J. A. Foley, 2008. Farming the planet: 2. Geographic distribution of crop areas, yields, physiological types, and net primary production in the year 2000, Global Biogeochem. Cycles, 22(1): GB1022.Thenkabail, P. S.; Mariotto, I.; Gumma, M. K.; Middleton, E. M.; Landis, D. R.; Huemmrich, K. F. Selection of hyperspectral narrowbands (HNBs) and composition of hyperspectral twoband vegetation indices (HVIs) for biophysical characterization and discrimination of crop types using field reflectance and Hyperion/EO-1 data; 2013; Article; Journal; IEEE Journal of Selected Topics in Applied Earth Observations and Remote Sensing;
Research conducted over the last 50 years (by the global remote sensing community)
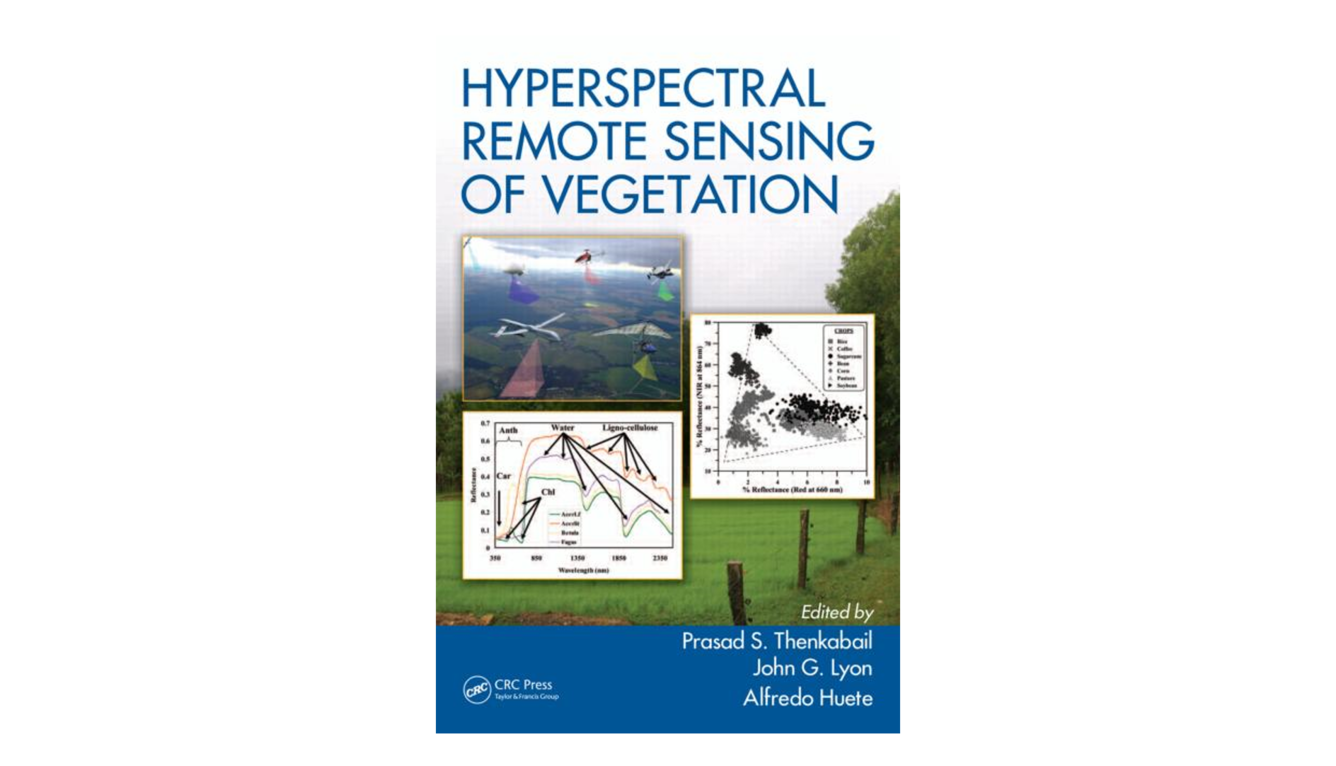
The secondary focus is on the compendium of the hyperspectral remote sensing of vegetation and agricultural crops research conducted by a large community of global researchers over the last 50 years. This is summarized in the book “Hyperspectral Remote Sensing of Vegetation” (Publisher: Taylor and Francis, Inc., see Figure 3).
However, a more comprehensive 4-volume “Hyperspectral Remote Sensing of Vegetation and Agricultural Crops” (Publisher: Taylor and Francis, Inc.) has been published by the end of 2018 or early 2019.
Global hyperspectral imaging spectral-library of agricultural-crops (GHISA)
The tertiary focus is in establishing a global hyperspectral imaging spectral-library of agricultural-crops (GHISA) for some of the major crops of the world (Table 1) for various locations of the world and at various growth stages. The crops include wheat, rice, corn, soybeans, barley, and cotton (Table 1). Hyperspectral data for GHISA are gathered from ground-based (Figure 4) and spaceborne sensors (Table 2). Data gathered from field spectroscopy using spectroradimeters are illustrated in Figure 5 for some of the leading crops of the world. Such signatures constitute GHISA. Similar GHISA spectral signatures are gathered from various platforms (e.g., Figure 1 and Figure 6 from spaceborne EO-1 Hyperion).
Hyperspectral Remote Sensing or imaging spectroscopy, originally used for detecting and mapping minerals, is increasingly needed to characterize, model, classify, and map agricultural crops and natural vegetation, specifically in the study of:
Species composition (e.g., Chromolenea odorata vs. Imperata cylindrica),
Vegetation or crop type (e.g., soybeans vs. corn),
Disease and stress (e.g., insect infestation, drought),
Nutrients (e.g., Nitrogen),
Moisture (e.g., leaf moisture),
Light use efficiency,
Net primary productivity and so on.
The goal of using hyperspectral narrowband (HNB) data, as opposed to multispectral broadband (MBB) data, is to increase accuracies and reduce uncertainties in the study of various vegetation and agricultural crop classification outcomes, and in modeling and mapping these quantities. The MBBs have limited bands (e.g., Landsat Operational Land Imager has 11 bands) whereas HNBs are available in 1000s of bands (e.g., EO-1 Hyperion has 242 bands in the 400-2500 nanometer range). A simple example is the depiction of various false color composites (FCCs) from EO-1 Hyperion HNBs relative to Landsat Enhanced Thematic Mapper Plus (ETM+) FCC of 4,3,2 as shown in Figure 7.
This Figure description is the same as that of Figure 8, except that the data are plotted here (Figure 9) in 400-940 nm as opposed to 400-2400 nm in Figure 8.
A wide range of hyperspectral research topics are covered here, such as:
hyperspectral sensors and their characteristics,
methods of overcoming the Hughes phenomenon,
characterizing biophysical and biochemical properties,
advances made in using hyperspectral data in modeling evapotranspiration or actual water use by plants,
study of phenology, light use efficiency, and gross primary productivity,
improved accuracies in species identification and land cover classifications, and
applications in precision agriculture.
One of the first goal of any hyperspectral data analysis is in dimensionality reduction to overcome data redundancy and to optimize the most valuable data for a given application. This requires data mining. Feature selection is necessary in any data mining effort. Feature selection reduces the dimensionality of data by selecting only a subset of measured features (predictor variables). Feature selection methods recommendation is based on:
Information Content (e.g., Selection based on Theoretical Knowledge, Band Variance, Information Entropy),
Projection-Based methods (e.g., Principal Component Analysis or PCA),
Similarity Measures (e.g., Correlation Coefficient, Spectral Derivative Analysis), and
Other Methods (e.g., Wavelet Decomposition Method).
Hyperspectral narrowband (HNB) data are known toprovide significant advances in modeling, mapping, and monitoring agricultural crop and vegetationbiophysical and biochemical quantities. Biophysical characteristics that are typically studied are (Figure 10):
Biomass: wet and dry (kg/m2),
Leaf area index (LAI),
Green LAI (m2/m2),
Plant height (mm),
Vegetation fraction (%),
Fraction of PAR absorbed by photosynthetically active vegetation (fAPAR) (MJ/m2),
Total crop chlorophyll content (g/m2), and
Gross primary production (g C/m2/yr).
Biochemistry (e.g., plant pigments, water, and structural carbohydrates): Leaf reflectance in the visible spectrum is dominated by absorption features created by plant pigments, such as:
chlorophyll a (chl-a): absorbs in 410-430 nm and 600-690 nm;
chlorophyll b (chl-b): absorbs in 450-470 nm;
carotenoids (e.g., β-carotene and lutein): peak absorption in wavebands <500 nm;
anthocyanins,
lignin, cellulose, protein, and
Nitrogen: relatively low reflectance and strong absorption in SWIR bands by water that masks other absorption features. However, dry leaves do not have strong water absorption and reveal overlapping absorptions by carbon compounds, such as lignin and cellulose, and other plant biochemicals, including protein, nitrogen, starch, and sugars.
Hyperspectral vegetation indices (HVIs) (Table 3) provide an opportunity to study specific biophysical and biochemical quantities more precisely than multispectral broadband derived indices. HVIs are either two-band or multi-band types. The novelties of HVIs include:
physically meaningful indices (e.g., Photochemical reflective index (PRI) as proxy for light use efficiency (LUE)),
significant improvement in sensor saturation relative to broadbands,
providing greater sensitivity (e.g., an index involving NIR reflective maxima @ 900 nm and red absorption maxima @ 680 nm);
new indices not sampled by broadbands such as water-based indices (e.g., involving 970 nm or 1240 nm along with a non-absorption band, and
multi-linear indices involving more than 2 bands.
The comprehensive research also recommends optimal hyperspectral narrowbands (see Table 4) and the best incremental bands (see Table 5) in the study of agriculture and vegetation.
The Global Hyperspectral Imaging Spectral-library of Agricultural crops (GHISA) is a collation of hyperspectral signatures (spaceborne, airborne, ground-based) of dominant global agricultural crops which together occupy about 65% of all global cropland areas. It is being developed by the USGS and partnering agencies from around the world.
GHISACONUS V001
The GHISA for the Conterminous United States (GHISACONUS) Version 1 product was developed using Earth Observing-1 (EO-1) Hyperion hyperspectral data acquired from 2008 through 2015 from different agroecological zones of CONUS for five major agricultural crops (e.g., winter wheat, rice, corn, soybeans, and cotton).
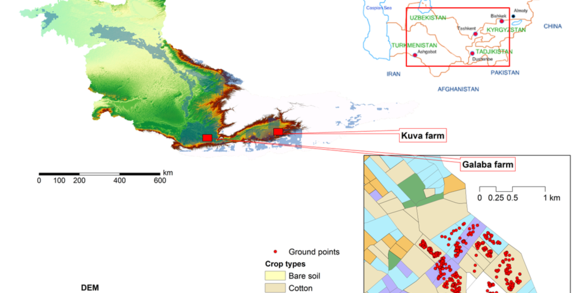
The GHISA for Central Asia (GHISACASIA) Version 1 product provides dominant crop data (wheat, rice, corn, alfalfa, and cotton) in different growth stages across the Galaba and Kuva farm fields in the Syr Darya river basin. It was developed using Earth Observing-1 (EO-1) Hyperion hyperspectral data acquired in 2007 and ASD Spectroradiometer data acquired in 2006 and 2007.
DESIS and PRISMA spectral library of agricultural crops in California's Central Valley in the 2020 Growing Season
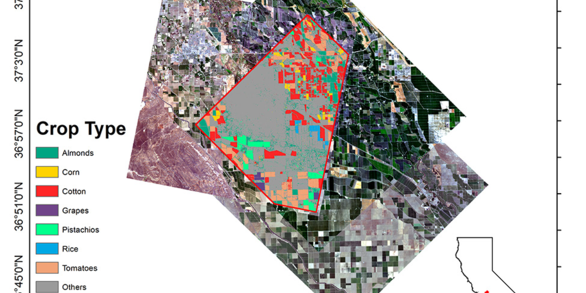
The DESIS and PRISMA Derived Spectral Library of Agricultural Crops in California was developed using 2020 DESIS and PRISMA data for almonds, corn, cotton, grapes, pistachios, rice, and tomatoes. For more details, see “New Generation Hyperspectral Sensors DESIS and PRISMA Provide Improved Agricultural Crop Classifications” (DOI: 10.14358/PERS.22-00039R2)
This data release contains spectra used to evaluate narrow-band shortwave infrared indices suitable for measurement of non-photosynthetic vegetation (NPV). The original data were collected using a proximal Analytical Spectral Devices (ASD) FieldSpecPro spectroradiometer, and are also provided in various states of processing, all of which is described in the manuscripts referenced below...
Here we provide information for the PlanetScope and d Deutsches Zentrum fur Luft- und Raumfahrt (DLR) Earth Sensing Imaging Spectrometer (DESIS) Derived Spectral Library of Agricultural Crops in California which was developed using PlanetScope Dove-R high spatial resolution data and DESIS hyperspectral data acquired for 2020. PlanetScope images are available through Planet Labs (2022)...
Hyperspectral sensors provide near-continuous spectral data that can facilitate advancements in agricultural crop classification and characterization, which are important for addressing global food and water security issues. We investigated two new-generation hyperspectral sensors, Germany’s Deutsches Zentrum für Luft‐ und Raumfahrt Earth Sensing Imaging Spectrometer (DESIS) and Italy’s...
Authors
Itiya P. Aneece, Prasad Thenkabail, Richard L. McCormick, Alifu Haireti, Daniel Foley, Adam Oliphant, Pardhasaradhi Teluguntla
Using new remote sensing technology to study agricultural crops will support advances in food and water security. The recently launched, new generation spaceborne hyperspectral sensors, German DLR Earth Sensing Imaging Spectrometer (DESIS) and Italian PRecursore IperSpettrale della Missione Applicativa (PRISMA), provide unprecedented data in hundreds of narrow spectral bands for the...
Thoroughly investigating the characteristics of new generation hyperspectral and high spatial resolution spaceborne sensors will advance the study of agricultural crops. Therefore, we compared the performances of hyperspectral Deutsches Zentrum fur Luftund Raumfahrt- (DLR) Earth Sensing Imaging Spectrometer (DESIS) and high spatial resolution PlanetScope in classifying eight crop types...
Authors
Itiya P. Aneece, Daniel Foley, Prasad Thenkabail, Adam Oliphant, Pardhasaradhi G. Teluguntla
Advances in spaceborne hyperspectral (HS) remote sensing, cloud-computing, and machine learning can help measure, model, map and monitor agricultural crops to address global food and water security issues, such as by providing accurate estimates of crop area and yield to model agricultural productivity. Leveraging these advances, we used the Earth Observing-1 (EO-1) Hyperion historical...
As the global population increases, we face increasing demand for food and nutrition. Remote sensing can help monitor food availability to assess global food security rapidly and accurately enough to inform decision-making. However, advances in remote sensing technology are still often limited to multispectral broadband sensors. Although these sensors have many applications, they can be...
A second edition of the Hyperspectral Remote Sensing of Vegetation (Four Volume-Set) is published by CRC Press/Taylor and Francis Inc. The book is edited by Dr. Prasad Thenkabail, Dr. John Lyons, and Dr. Alfredo Huete.
This webpage showcases the key research advances made in hyperspectral remote sensing of agricultural crops and vegetation over the last 50 years. There are three focus areas:
Ongoing research in Global Hyperspectral Imaging Spectral-library of Agricultural-Crops (GHISA)
Hyperspectral Imaging Spectroscopy (HIS) provides the most advanced next-generation remote sensing data in the spectral domain in the form of spectral signatures for every pixel observed as opposed to data from a few spectral data points of the current generation of sensors (Figure A). This will help us advance our understanding of Planet Earth through more accurate and precise models, maps, and monitoring capabilities. Given, this importance, Dr. Itiya Aneece and Dr. Prasad Thenkabail of the United States Geological Survey (USGS) conduct a detailed study of five leading world agricultural crops (corn, soybean, winter wheat, rice, and cotton) that occupy 75% and 54% of principal crop areas in the United States and the world respectively using HIS data from Earth Observing-1 (EO-1) Hyperion data by utilizing 99 images spread across various agroecological zones (AEZs) of USA (Figure B). The study established optimal hyperspectral narrowbands (HNBs) to study agricultural crops, conducted dimension reduction studies through data mining approaches, and established accuracies and errors in classifying Hyperion images for crop type mapping using machine learning algorithms (e.g., Support Vector Machines) on the Google Earth Engine (GEE) cloud computing platform. The study will make a significant contribution to upcoming hyperspectral sensors such as the recently launched HysIS (Hyperspectral Imaging Satellite of India with 55 bands in 400-950 nm VNIR and 165 bands in 900-2500 nm SWIR) by India, and NASA’s Surface Biology and Geology (SBG) mission. This study built a novel, first-of-its-kind, global hyperspectral imaging spectral-library of agricultural crops (Figure A). For detailed descriptions of Hyperion image processing and compilation of GHISA, please refer to Chapter 9 on Hyperion preprocessing in this book, Google Earth Engine code, and the manuscript “Accuracies achieved in classifying five leading world crop types and their growth stages using optimal Earth Observing-1 Hyperion hyperspectral narrowbands on Google Earth Engine” published in the Remote Sensing open-access journal providing details of Global Hyperspectral Imaging Spectral-library of Agricultural-crops (GHISA). The GHISA derived hyperspectral library (example Figure B below) will be of immense value to understand, model, map, and monitor agricultural crops within and across agroecological zones (Figure B).
Research conducted over the last 20 years (by Dr. Prasad S. Thenkabail’s group)
The primary focus is on the seminal research conducted over the last 20 years by this group using hyperspectral data of agricultural crops and vegetation, gathered from around the world, from various platforms: ground-based, platform-mounted, drone or unmanned aerial vehicle (UAV)-based, airborne, and spaceborne. The leading world crops studied include wheat, rice, corn, soybeans, barley, cotton, and alfalfa (Table 1). Natural vegetation in the African savannas and rainforests were also studied using hyperspectral (or imaging spectroscopy) data. For example, Figure 1 illustrates Earth Observing-1 (EO-1) Hyperion hyperspectral Data Cube from which agricultural crop spectral libraries are derived for some of the leading world crops. Figure 2 illustrates EO-1 Hyperion hyperspectral data cube for data acquired over African rainforests.
Table 1: Cropland Areas (Thenkabail et al., 2013; Monfreda et al., 2008)Source:Monfreda, C., N. Ramankutty, and J. A. Foley, 2008. Farming the planet: 2. Geographic distribution of crop areas, yields, physiological types, and net primary production in the year 2000, Global Biogeochem. Cycles, 22(1): GB1022.Thenkabail, P. S.; Mariotto, I.; Gumma, M. K.; Middleton, E. M.; Landis, D. R.; Huemmrich, K. F. Selection of hyperspectral narrowbands (HNBs) and composition of hyperspectral twoband vegetation indices (HVIs) for biophysical characterization and discrimination of crop types using field reflectance and Hyperion/EO-1 data; 2013; Article; Journal; IEEE Journal of Selected Topics in Applied Earth Observations and Remote Sensing;
Research conducted over the last 50 years (by the global remote sensing community)
The secondary focus is on the compendium of the hyperspectral remote sensing of vegetation and agricultural crops research conducted by a large community of global researchers over the last 50 years. This is summarized in the book “Hyperspectral Remote Sensing of Vegetation” (Publisher: Taylor and Francis, Inc., see Figure 3).
However, a more comprehensive 4-volume “Hyperspectral Remote Sensing of Vegetation and Agricultural Crops” (Publisher: Taylor and Francis, Inc.) has been published by the end of 2018 or early 2019.
Global hyperspectral imaging spectral-library of agricultural-crops (GHISA)
The tertiary focus is in establishing a global hyperspectral imaging spectral-library of agricultural-crops (GHISA) for some of the major crops of the world (Table 1) for various locations of the world and at various growth stages. The crops include wheat, rice, corn, soybeans, barley, and cotton (Table 1). Hyperspectral data for GHISA are gathered from ground-based (Figure 4) and spaceborne sensors (Table 2). Data gathered from field spectroscopy using spectroradimeters are illustrated in Figure 5 for some of the leading crops of the world. Such signatures constitute GHISA. Similar GHISA spectral signatures are gathered from various platforms (e.g., Figure 1 and Figure 6 from spaceborne EO-1 Hyperion).
Hyperspectral Remote Sensing or imaging spectroscopy, originally used for detecting and mapping minerals, is increasingly needed to characterize, model, classify, and map agricultural crops and natural vegetation, specifically in the study of:
Species composition (e.g., Chromolenea odorata vs. Imperata cylindrica),
Vegetation or crop type (e.g., soybeans vs. corn),
Disease and stress (e.g., insect infestation, drought),
Nutrients (e.g., Nitrogen),
Moisture (e.g., leaf moisture),
Light use efficiency,
Net primary productivity and so on.
The goal of using hyperspectral narrowband (HNB) data, as opposed to multispectral broadband (MBB) data, is to increase accuracies and reduce uncertainties in the study of various vegetation and agricultural crop classification outcomes, and in modeling and mapping these quantities. The MBBs have limited bands (e.g., Landsat Operational Land Imager has 11 bands) whereas HNBs are available in 1000s of bands (e.g., EO-1 Hyperion has 242 bands in the 400-2500 nanometer range). A simple example is the depiction of various false color composites (FCCs) from EO-1 Hyperion HNBs relative to Landsat Enhanced Thematic Mapper Plus (ETM+) FCC of 4,3,2 as shown in Figure 7.
This Figure description is the same as that of Figure 8, except that the data are plotted here (Figure 9) in 400-940 nm as opposed to 400-2400 nm in Figure 8.
A wide range of hyperspectral research topics are covered here, such as:
hyperspectral sensors and their characteristics,
methods of overcoming the Hughes phenomenon,
characterizing biophysical and biochemical properties,
advances made in using hyperspectral data in modeling evapotranspiration or actual water use by plants,
study of phenology, light use efficiency, and gross primary productivity,
improved accuracies in species identification and land cover classifications, and
applications in precision agriculture.
One of the first goal of any hyperspectral data analysis is in dimensionality reduction to overcome data redundancy and to optimize the most valuable data for a given application. This requires data mining. Feature selection is necessary in any data mining effort. Feature selection reduces the dimensionality of data by selecting only a subset of measured features (predictor variables). Feature selection methods recommendation is based on:
Information Content (e.g., Selection based on Theoretical Knowledge, Band Variance, Information Entropy),
Projection-Based methods (e.g., Principal Component Analysis or PCA),
Similarity Measures (e.g., Correlation Coefficient, Spectral Derivative Analysis), and
Other Methods (e.g., Wavelet Decomposition Method).
Hyperspectral narrowband (HNB) data are known toprovide significant advances in modeling, mapping, and monitoring agricultural crop and vegetationbiophysical and biochemical quantities. Biophysical characteristics that are typically studied are (Figure 10):
Biomass: wet and dry (kg/m2),
Leaf area index (LAI),
Green LAI (m2/m2),
Plant height (mm),
Vegetation fraction (%),
Fraction of PAR absorbed by photosynthetically active vegetation (fAPAR) (MJ/m2),
Total crop chlorophyll content (g/m2), and
Gross primary production (g C/m2/yr).
Biochemistry (e.g., plant pigments, water, and structural carbohydrates): Leaf reflectance in the visible spectrum is dominated by absorption features created by plant pigments, such as:
chlorophyll a (chl-a): absorbs in 410-430 nm and 600-690 nm;
chlorophyll b (chl-b): absorbs in 450-470 nm;
carotenoids (e.g., β-carotene and lutein): peak absorption in wavebands <500 nm;
anthocyanins,
lignin, cellulose, protein, and
Nitrogen: relatively low reflectance and strong absorption in SWIR bands by water that masks other absorption features. However, dry leaves do not have strong water absorption and reveal overlapping absorptions by carbon compounds, such as lignin and cellulose, and other plant biochemicals, including protein, nitrogen, starch, and sugars.
Hyperspectral vegetation indices (HVIs) (Table 3) provide an opportunity to study specific biophysical and biochemical quantities more precisely than multispectral broadband derived indices. HVIs are either two-band or multi-band types. The novelties of HVIs include:
physically meaningful indices (e.g., Photochemical reflective index (PRI) as proxy for light use efficiency (LUE)),
significant improvement in sensor saturation relative to broadbands,
providing greater sensitivity (e.g., an index involving NIR reflective maxima @ 900 nm and red absorption maxima @ 680 nm);
new indices not sampled by broadbands such as water-based indices (e.g., involving 970 nm or 1240 nm along with a non-absorption band, and
multi-linear indices involving more than 2 bands.
The comprehensive research also recommends optimal hyperspectral narrowbands (see Table 4) and the best incremental bands (see Table 5) in the study of agriculture and vegetation.
The Global Hyperspectral Imaging Spectral-library of Agricultural crops (GHISA) is a collation of hyperspectral signatures (spaceborne, airborne, ground-based) of dominant global agricultural crops which together occupy about 65% of all global cropland areas. It is being developed by the USGS and partnering agencies from around the world.
GHISACONUS V001
The GHISA for the Conterminous United States (GHISACONUS) Version 1 product was developed using Earth Observing-1 (EO-1) Hyperion hyperspectral data acquired from 2008 through 2015 from different agroecological zones of CONUS for five major agricultural crops (e.g., winter wheat, rice, corn, soybeans, and cotton).
The GHISA for Central Asia (GHISACASIA) Version 1 product provides dominant crop data (wheat, rice, corn, alfalfa, and cotton) in different growth stages across the Galaba and Kuva farm fields in the Syr Darya river basin. It was developed using Earth Observing-1 (EO-1) Hyperion hyperspectral data acquired in 2007 and ASD Spectroradiometer data acquired in 2006 and 2007.
DESIS and PRISMA spectral library of agricultural crops in California's Central Valley in the 2020 Growing Season
The DESIS and PRISMA Derived Spectral Library of Agricultural Crops in California was developed using 2020 DESIS and PRISMA data for almonds, corn, cotton, grapes, pistachios, rice, and tomatoes. For more details, see “New Generation Hyperspectral Sensors DESIS and PRISMA Provide Improved Agricultural Crop Classifications” (DOI: 10.14358/PERS.22-00039R2)
This data release contains spectra used to evaluate narrow-band shortwave infrared indices suitable for measurement of non-photosynthetic vegetation (NPV). The original data were collected using a proximal Analytical Spectral Devices (ASD) FieldSpecPro spectroradiometer, and are also provided in various states of processing, all of which is described in the manuscripts referenced below...
Here we provide information for the PlanetScope and d Deutsches Zentrum fur Luft- und Raumfahrt (DLR) Earth Sensing Imaging Spectrometer (DESIS) Derived Spectral Library of Agricultural Crops in California which was developed using PlanetScope Dove-R high spatial resolution data and DESIS hyperspectral data acquired for 2020. PlanetScope images are available through Planet Labs (2022)...
Hyperspectral sensors provide near-continuous spectral data that can facilitate advancements in agricultural crop classification and characterization, which are important for addressing global food and water security issues. We investigated two new-generation hyperspectral sensors, Germany’s Deutsches Zentrum für Luft‐ und Raumfahrt Earth Sensing Imaging Spectrometer (DESIS) and Italy’s...
Authors
Itiya P. Aneece, Prasad Thenkabail, Richard L. McCormick, Alifu Haireti, Daniel Foley, Adam Oliphant, Pardhasaradhi Teluguntla
Using new remote sensing technology to study agricultural crops will support advances in food and water security. The recently launched, new generation spaceborne hyperspectral sensors, German DLR Earth Sensing Imaging Spectrometer (DESIS) and Italian PRecursore IperSpettrale della Missione Applicativa (PRISMA), provide unprecedented data in hundreds of narrow spectral bands for the...
Thoroughly investigating the characteristics of new generation hyperspectral and high spatial resolution spaceborne sensors will advance the study of agricultural crops. Therefore, we compared the performances of hyperspectral Deutsches Zentrum fur Luftund Raumfahrt- (DLR) Earth Sensing Imaging Spectrometer (DESIS) and high spatial resolution PlanetScope in classifying eight crop types...
Authors
Itiya P. Aneece, Daniel Foley, Prasad Thenkabail, Adam Oliphant, Pardhasaradhi G. Teluguntla
Advances in spaceborne hyperspectral (HS) remote sensing, cloud-computing, and machine learning can help measure, model, map and monitor agricultural crops to address global food and water security issues, such as by providing accurate estimates of crop area and yield to model agricultural productivity. Leveraging these advances, we used the Earth Observing-1 (EO-1) Hyperion historical...
As the global population increases, we face increasing demand for food and nutrition. Remote sensing can help monitor food availability to assess global food security rapidly and accurately enough to inform decision-making. However, advances in remote sensing technology are still often limited to multispectral broadband sensors. Although these sensors have many applications, they can be...
A second edition of the Hyperspectral Remote Sensing of Vegetation (Four Volume-Set) is published by CRC Press/Taylor and Francis Inc. The book is edited by Dr. Prasad Thenkabail, Dr. John Lyons, and Dr. Alfredo Huete.