
GHISA Illustration - Figure B
Detailed Description
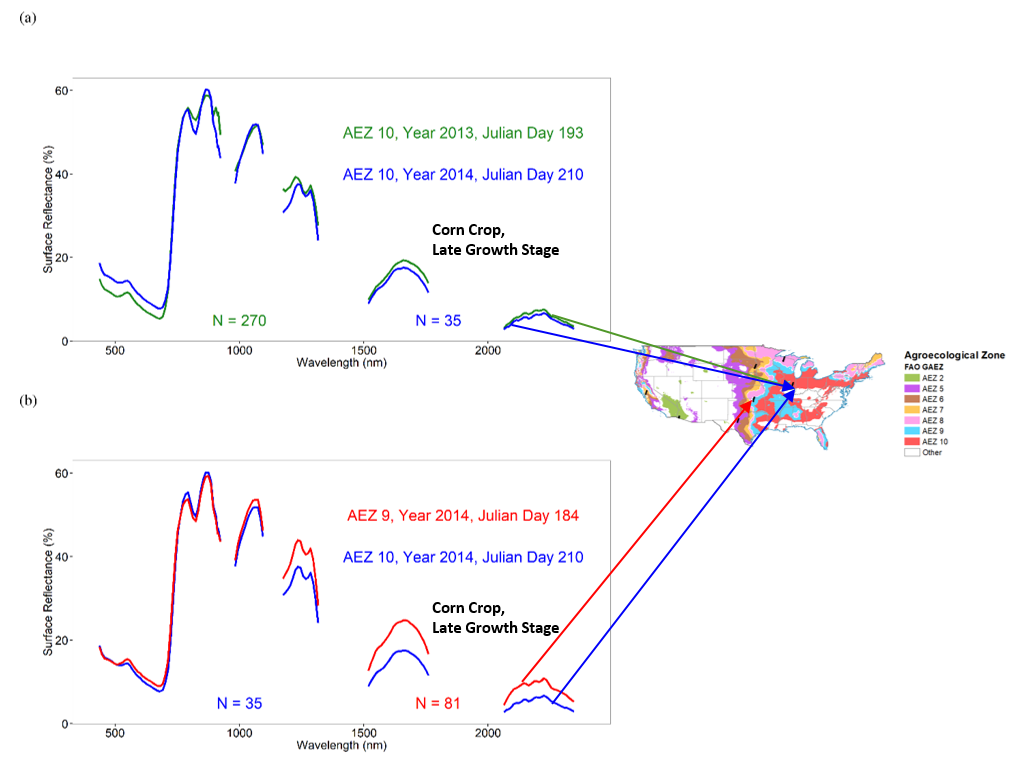
Figure B. Global Hyperspectral Imaging Spectral-library of Agricultural-Crops (GHISA) illustration. In this figure, we illustrate how the GHISA spectral library of agricultural crops is used to understand hyperspectral signatures of crops. The GHISA “hyperspectral signatures” shown above are derived using Earth Observing-1 (EO-1) Hyperion data from two agroecological zones (AEZs) of USA for the corn crop at late growth stages. In Figure Ba (top sub-figure) corn crop hyperspectral signatures of AEZ10 from two years (2013 and 2014) are compared when the crop is in the late growth stage. The Julian day for which data are acquired is 193 during 2013 and 210 during 2014. This 17-day difference in acquisition days, as well as some other differences (e.g., variability due to differences in available water from year to year, and other management practices, if any), causes slight differences in hyperspectral signatures of two years. Otherwise, there is excellent spectral matching between the spectra across two years. Similarly, in Figure Bb (bottom sub-figure) hyperspectral signatures of corn crop, also in the late growth stage, were compared for two different AEZs (AEZ9 versus AEZ10) but for the same year (2014). Again the difference in Julian days causes differences in the two hyperspectral signatures. [Source: Aneece and Thenkabail, 2018].
Sources/Usage
Courtesy: Dr. Prasad Thenkabail
Related

Global Hyperspectral Imaging Spectral-library of Agricultural-Crops & Vegetation (GHISA)
Related