
Hyperspectral Signatures

Detailed Description
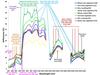
Figure 10: Hyperspectral signatures in 400-2500 nanometers for some of the leading world agricultural-crops. Hyperspectral data are acquired near-continuously in 1 to 10 nm bandwidths over 400-2500 nm. The figure highlights the specific biophysical and biochemical quantities studied in various portions of the spectrum. Hyperspectral data help in advancing our understanding, modeling, mapping, and monitoring capabilities of agricultural crops and vegetation relative to broadband multispectral data. (Thenkabail et al. 2013, 2015)
Source:
Modified and adopted from:
Thenkabail, P.S., Mariotto, I., Gumma, M.K.,, Middleton, E.M., Landis, and D.R., Huemmrich, F.K., 2013. Selection of hyperspectral narrowbands (HNBs) and composition of hyperspectral twoband vegetation indices (HVIs) for biophysical characterization and discrimination of crop types using field reflectance and Hyperion/EO-1 data. IEEE JOURNAL OF SELECTED TOPICS IN APPLIED EARTH OBSERVATIONS AND REMOTE SENSING, Pp. 427-439, VOL. 6, NO. 2, APRIL 2013.doi: 10.1109/JSTARS.2013.2252601. (80%). IP-037139.
Thenkabail, P.S., 2015. Hyperspectral Remote Sensing for Terrestrial Applications, Chapter 9. In Thenkabail, P.S., (Editor-in-Chief), 2015. “Remote Sensing Handbook” (Volume II): Land Resources Monitoring, Modeling, and Mapping with Remote Sensing. Taylor and Francis Inc.\CRC Press, Boca Raton, London, New York. ISBN 9781482217957 - CAT# K22130. Pp. 201-236. IP-0606312.
Sources/Usage
Courtesy: Prasad Thenkabail
Related

Global Hyperspectral Imaging Spectral-library of Agricultural-Crops & Vegetation (GHISA)
Related