
Data Story: Hurricane Florence
Water quality data for national‐scale aquatic research
Interactive Data Visualizations
Multi-figure, interactive data visualization to illuminate challenging concepts related to water use around the U.S. in 2015
Bayesian Modeling With High-Throughput Computing
The first national assessment of many-day time series of metabolic rates created using high-throughput computing to reduce model run-time.
Data Pipelines
Enhancing scientific research with reproducible, collaborative, and scalable data analysis workflows and methodologies.
Data scientists in the USGS Water Resources Mission Area make sense of large environmental and operational datasets by applying various modeling, statistical, and visualization techniques to generate actionable information.
Technological advances are driving exponential growth in data, improving the efficiency of many sectors and disrupting others. Extracting meaningful information quickly from the modern-day deluge of data is now a requirement for being successful. However, generating decision-ready data or predicting future outcomes from environmental or operational data is challenging and requires specialized skills. Research teams can tap into big data insights through the inclusion of data scientists — individuals with interdisciplinary backgrounds that include data analysis, statistics, data visualization, computer science, and mathematics.
At the USGS, water data science is focused on the following:
-
Modeling: Combine theory-based models with powerful empirical predictive tools (e.g., deep learning)
-
Data pipelines: Build efficiency through reproducible and collaborative data workflows
-
Data visualizations: Share insights with innovative and thoughtful visualizations
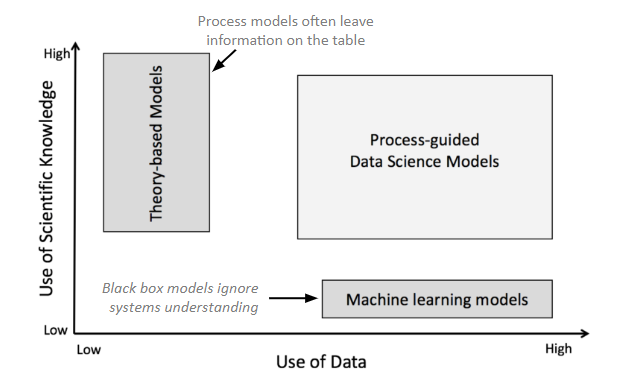
USGS has a rich history in the development and application of process-based models. These models are formulated based on known environmental relationships and are the de facto tool for water resources predictions. Alternatively, new deep learning (DL; a subset of machine learning) tools deliver improved prediction accuracy by resolving complex relationships in large quantities of data, and have great potential to aid scientific discovery for water resources. Theory-Guided Data Science modeling (figure 1; Karpatne et al. 2017) integrates process understanding into advanced machine learning modeling techniques. Data science collaborations with computer scientists at the University of Minnesota (V Kumar) and Virginia Tech (A Karpatne) are building and testing these hybrid modeling frameworks on water predictions.
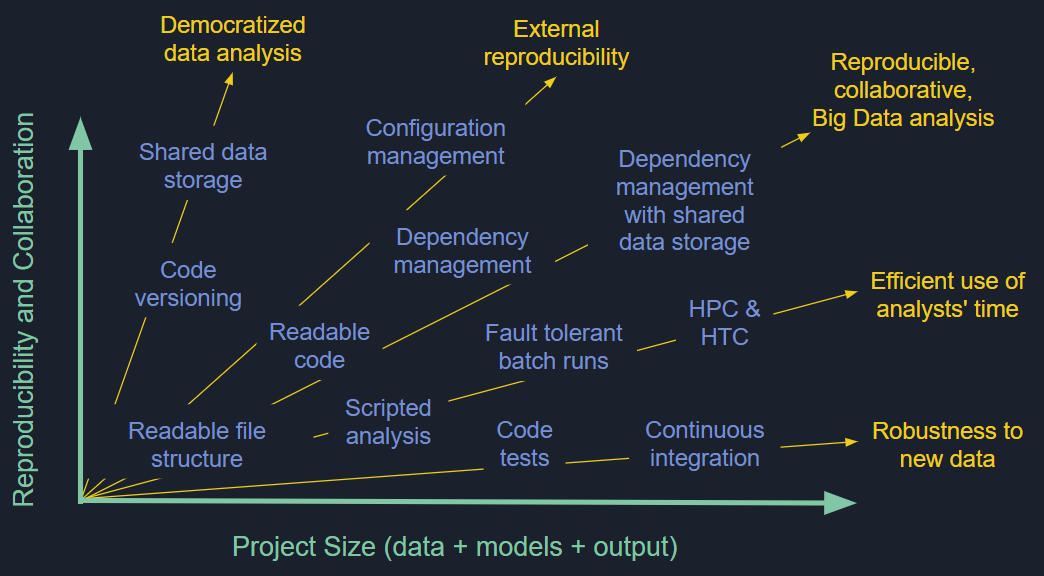
In addition to new modeling development, there is a growing emphasis on interdisciplinary research that necessitates integration of large, disparate datasets. Scientific workflows and computing methods must continually evolve to meet these challenges; however, current techniques for accessing and using data are not sufficient. Data scientists at the USGS develop and build tools that enable reproducible and collaborative data workflows (figure 2) and collaborate on research projects to assist on the challenges of data integration.
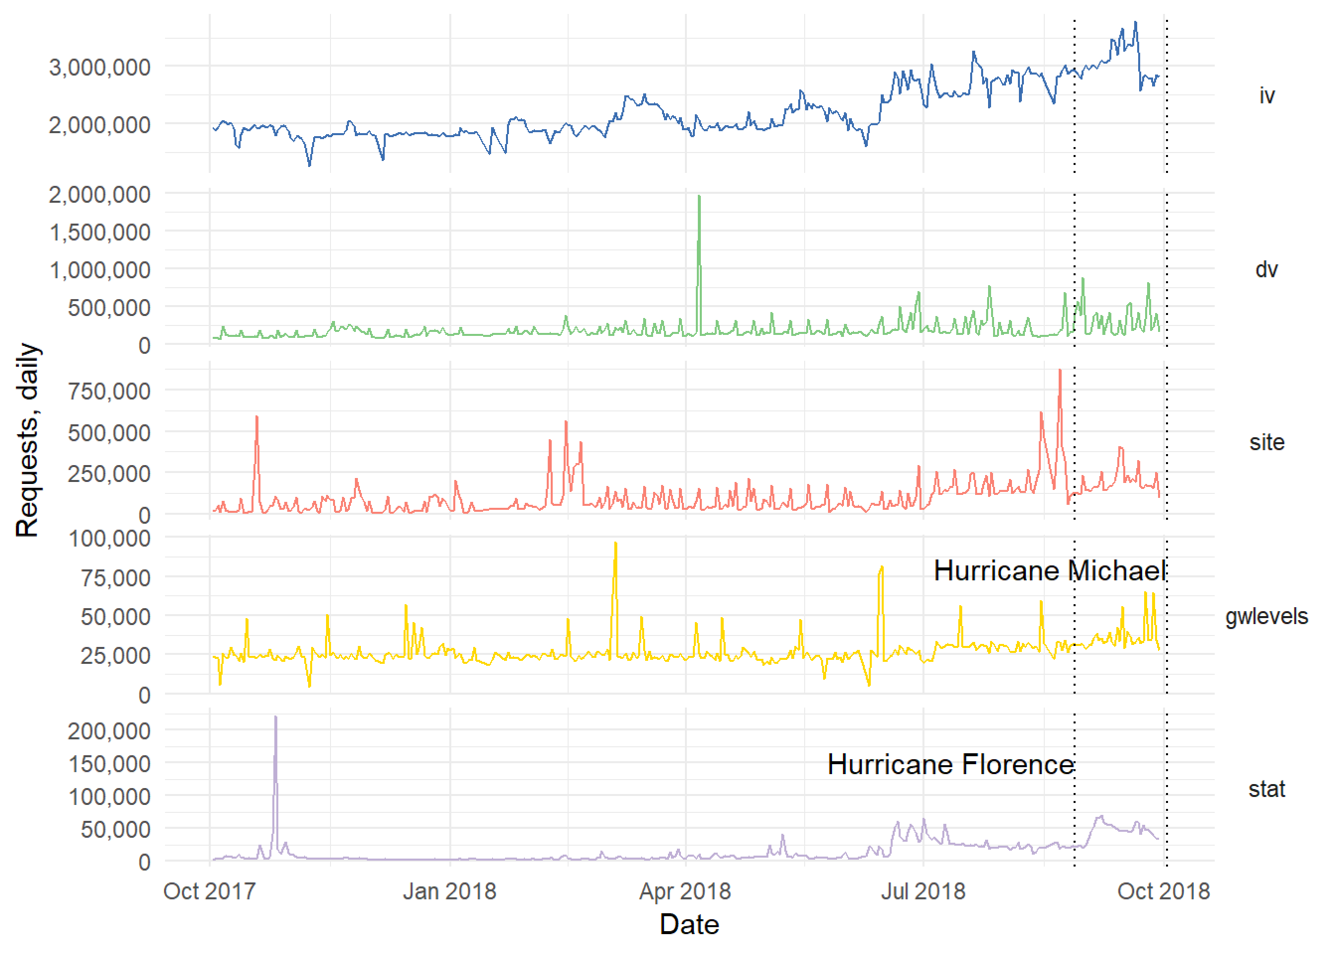
Beyond traditional scientific research, operational data and web analytics are important applications of data science in the USGS WMA. The primary platform for communicating with stakeholders, taxpayers, and Congress is the Web. Web products can be improved based on learning more about user behavior and user needs by capturing and analyzing website interactions. Data scientists are applying data science methods to operational data (figure 3) to help optimize web product development and improve the likelihood that stakeholders will find and use our products.
Data visualization is a valuable tool for making high-volume, complex data accessible to stakeholders, policy makers, and managers to facilitate data-driven conversations about environmental issues. While scientists are adept at creating graphs and figures that display scientific data and results, data science can strengthen scientific visual products and expand their reach to more diverse audiences (figure 4). See examples of USGS data visualizations here.
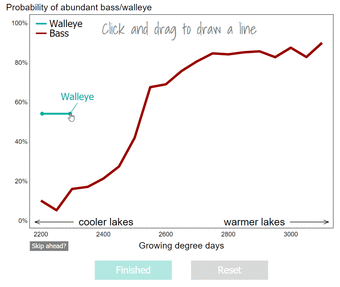
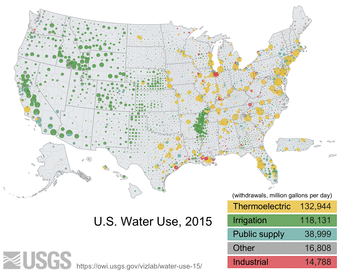
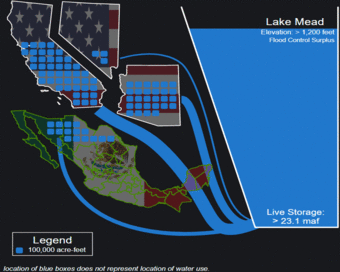
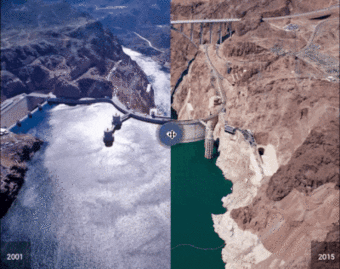
Figure 4. Collection of visualizations that take complex data and make them accessible to non-scientific audiences.
Want to learn more about data science at the USGS Water Resources Mission Area? Contact water-data-science@usgs.gov, explore related publications, data and tools, visualizations, or view relevant posts on the USGS water data blog.
Data scientists in the USGS Water Resources Mission Area make sense of large environmental and operational datasets by applying various modeling, statistical, and visualization techniques to generate actionable information.
Technological advances are driving exponential growth in data, improving the efficiency of many sectors and disrupting others. Extracting meaningful information quickly from the modern-day deluge of data is now a requirement for being successful. However, generating decision-ready data or predicting future outcomes from environmental or operational data is challenging and requires specialized skills. Research teams can tap into big data insights through the inclusion of data scientists — individuals with interdisciplinary backgrounds that include data analysis, statistics, data visualization, computer science, and mathematics.
At the USGS, water data science is focused on the following:
-
Modeling: Combine theory-based models with powerful empirical predictive tools (e.g., deep learning)
-
Data pipelines: Build efficiency through reproducible and collaborative data workflows
-
Data visualizations: Share insights with innovative and thoughtful visualizations
USGS has a rich history in the development and application of process-based models. These models are formulated based on known environmental relationships and are the de facto tool for water resources predictions. Alternatively, new deep learning (DL; a subset of machine learning) tools deliver improved prediction accuracy by resolving complex relationships in large quantities of data, and have great potential to aid scientific discovery for water resources. Theory-Guided Data Science modeling (figure 1; Karpatne et al. 2017) integrates process understanding into advanced machine learning modeling techniques. Data science collaborations with computer scientists at the University of Minnesota (V Kumar) and Virginia Tech (A Karpatne) are building and testing these hybrid modeling frameworks on water predictions.
In addition to new modeling development, there is a growing emphasis on interdisciplinary research that necessitates integration of large, disparate datasets. Scientific workflows and computing methods must continually evolve to meet these challenges; however, current techniques for accessing and using data are not sufficient. Data scientists at the USGS develop and build tools that enable reproducible and collaborative data workflows (figure 2) and collaborate on research projects to assist on the challenges of data integration.
Beyond traditional scientific research, operational data and web analytics are important applications of data science in the USGS WMA. The primary platform for communicating with stakeholders, taxpayers, and Congress is the Web. Web products can be improved based on learning more about user behavior and user needs by capturing and analyzing website interactions. Data scientists are applying data science methods to operational data (figure 3) to help optimize web product development and improve the likelihood that stakeholders will find and use our products.
Data visualization is a valuable tool for making high-volume, complex data accessible to stakeholders, policy makers, and managers to facilitate data-driven conversations about environmental issues. While scientists are adept at creating graphs and figures that display scientific data and results, data science can strengthen scientific visual products and expand their reach to more diverse audiences (figure 4). See examples of USGS data visualizations here.
Figure 4. Collection of visualizations that take complex data and make them accessible to non-scientific audiences.
Want to learn more about data science at the USGS Water Resources Mission Area? Contact water-data-science@usgs.gov, explore related publications, data and tools, visualizations, or view relevant posts on the USGS water data blog.