
Documenting the Deluge: USGS Teams Search South Louisiana to Determine Recent Flood’s Highest Peak
USGS Teams Search South Louisiana to Determine Recent Flood’s Highest Peak
After the floodwaters recede, the search for the high-water marks begins
As water levels recede from the recent flooding in south Louisiana, one of the central questions the U.S. Geological Survey is trying to answer is a seemingly simple one: How high did the water get? Believe it or not, though, figuring that out and producing an accurate map for hundreds of square miles of flood area is a complex challenge that involves detailed science, hundreds of data points, and lots of hard work.
During flooding events, rising waters are loaded with floating debris that can stick to buildings, trees, or other structures. When the water reaches its highest point, the line of debris that remains is the high-water mark.
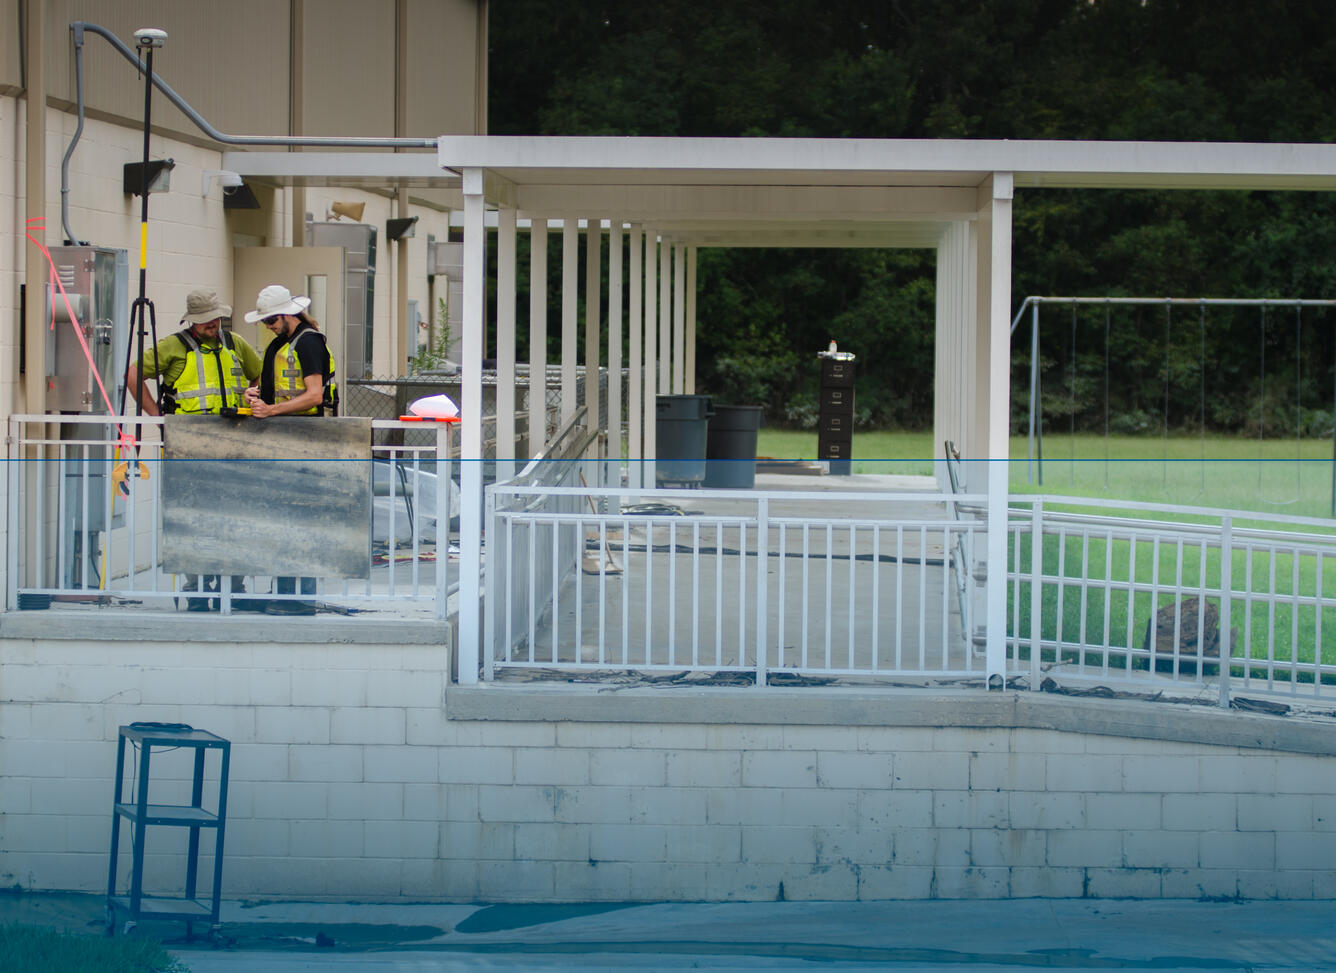
Following the Louisiana floods, USGS scientists and technicians immediately set out to begin the process of identifying high-water marks. More than twenty scientists from Alabama, Arkansas, Georgia, Oklahoma, Tennessee, and Texas came to help the Baton Rouge-based crews, many of whom had other flood work and had to recover personally from the floods.
High Quality Data from High-Water Marks
After most major floods, USGS partners with the Federal Emergency Management Agency, the U.S. Army Corps of Engineers, the National Weather Service, and other agencies to identify high-water marks throughout the affected areas. These high-water marks are used for a variety of purposes, mostly to improve models used for predicting the severity of future floods.
The most important use for the high-water marks is to allow for comparison and revision of FEMA’s existing flood risk maps. These maps help FEMA identify areas that are likely to experience high water in the event of a flood that has a 1 percent chance of happening in any given year. These floods, known as 100-year floods, are the most common severe inundation events, and serve as the foundation for flood management planning.
FEMA uses the high-water mark data to assess their 100-year flood maps and make future revisions, so that the latest data is incorporated to make the 100-year flood inundation maps as accurate as possible. These maps show what areas are at risk to flood waters, and if the flood is more severe, what additional areas come under threat. To help with that effort, USGS crews will go along the edges of the flood risk zones and identify if flooding occurred and how high the water got.

Another significant use for these high-water marks is the USGS Flood Inundation Mapping effort. A flood inundation map library is a set of maps that shows where flooding may occur over a range of water levels in the community’s local stream or river.
Inundation maps are one factor used to determine where changes should take place in building codes to help communities be more resilient; where evacuation routes should be; where (and how high) a bridge or road should be; and other community planning efforts. In addition, flood inundation maps can shorten response times from first-responders and even aid with environmental and ecological assessments by identifying wetlands and help with hazardous spill cleanup.
Once these flood inundation maps are complete, they’re uploaded to the USGS Flood Inundation Mapper, which allows users to explore the full set of inundation maps that shows where flooding would occur given a selected stream condition. Users can also access historical flood information and potential loss estimates based on the severity of the flood.

Nailing the Mark
So that’s some ways high-water marks are used, but how are they collected? That is where it can get complex. Usually, USGS crews look for clearly defined lines on buildings, preferably public buildings like businesses or governmental offices.
Many people associate high-water marks with mud lines on a building. However, because mud lines are easily altered, USGS scientists tend to use them as guidelines of where to start looking for better quality high-water marks.
Sometimes, when looking for a high-water mark on a building, USGS scientists’ efforts are thwarted by homeowners or business owners’ understandable desire to clean up. When that happens, our crews will seek out alternatives, like trees. However, with a tree, the water mark is usually much smaller than a water mark on a building, so another tree will usually be sought out to confirm the high-water mark.

The next step after the high-water mark is measured is to log it into a system so the actual height of the water can be verified from the elevation of the ground. GPS surveying is used to identify the location of the high-water mark, and then pre-existing ground elevation data for the location is applied.
During the course of a flood response, USGS crews will typically collect dozens, hundreds, or even thousands of high-water marks. So far, following the Louisiana floods, over 480 high-water marks have been collected across nine parishes, and over the coming days, many more will be flagged.
This particular high-water mark effort was unusual, because initially the marks were being flagged as quickly as possible without surveying them with GPS. The reason for this is there were several tropical depressions that are threatening the Louisiana coast, and the goal was to get the high-water marks identified before a new storm can wash them away. However, the hard work of these USGS teams has resulted in an adequate number of flagged high-water marks, and several teams have already begun the second phase of surveying these sites with GPS.