
USGS Hazard Science – Understanding the Risks is Key to Preparedness
Learn About USGS Hazards Science and More About National Preparedness Month: The very nature of natural hazards means that they have the potential to impact a majority of Americans every year. USGS science provides part of the foundation for emergency preparedness whenever and wherever disaster strikes.
Every year, the United States experiences dozens, if not hundreds, of natural hazard events that vary in size and impact from the incredibly large (like a hurricane or wide-spread flood) to the rather localized (like a sinkhole in a backyard). Regardless of the size or impact, every hazard event is unique, and they all provide an opportunity for USGS scientists to learn more about their causes and the best ways to help communities prepare for events, stay safe when they occur and recover once they are over.
This year, one of the more significant natural hazard events that garnered a lot of attention was the Ridgecrest earthquake sequence that started on the 4th of July in the Searles Valley in south-eastern California. USGS scientists were out in force to study this series of events in order to better understand the various dynamics of earthquakes like these so that information and data can be studied and analyzed in order to keep communities prepared and safe.

USGS work included conducting aerial and ground reconnaissance of the extensive surface rupture, deploying temporary seismic and geodetic stations to record aftershocks and coordinating efforts with military, state, local and academic partners.
The data collected and knowledge gained will help scientists identify which faults broke during the earthquake, determine the extent of faulting and surface displacement and locate areas of ground failure to better understand the earthquake and its aftershocks. Some of this information helps us refine the USGS National Seismic Hazards Model, which is a series of maps that reflect what we know about where shaking is likely to occur over decades — information that is used to develop building codes and design structures to withstand the expected shaking.
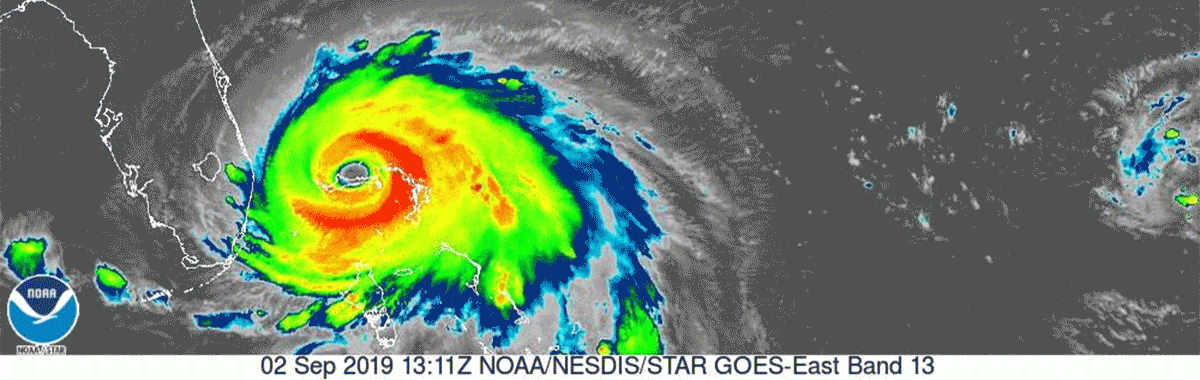
Additionally, hurricanes have the potential to impact – in sometimes devastating ways – large areas of the country, from the Gulf of Mexico all the way up the eastern seaboard and in the Pacific. While the number of hurricanes and tropical storms can vary from season to season, all it takes is one storm to make it a hurricane season to remember. This year, people in the northwestern Bahamas are just beginning their long road to recovery after Hurricane Dorian decimated parts of the island nation Sept. 1 through Sept. 3, and people from Florida to North Carolina’s Outer Banks are continuing cleanup efforts after Dorian skimmed along the nation's Atlantic coastline.

For Dorian, USGS coastal change experts released several coastal change hazard forecasts as the storm approached, up until the storm’s strong surge and waves began to impact the nation’s shorelines. USGS field crews deployed more than 350 storm-tide sensors and rapid deployment gauges from Florida to Virginia to document storm-tides and flood waters triggered by the hurricane. The scientific assessments based on data collected during Dorian can help communities recover from the effects of this storm and prepare for future storms. During hurricane seasons, the USGS provides scientific data that can inform decision makers as they make choices to protect the lives and property of millions of Americans.
The more we know about hazards, the more we can guard ourselves against their destructive impacts. The USGS is leading the way in providing information to support readiness and preparation for natural hazards. Our scientists, emergency managers, and administrators work with federal, state, and local agencies to understand hazards, communicate their potential risks and impacts and inform ways to mitigate large-scale loss of life and property.
USGS: Start with Science
The USGS works with many partners to monitor, assess and conduct research on a wide range of natural hazards. USGS science provides policymakers, emergency managers, and the public the understanding needed to enhance family and community preparedness, response, and resilience.
By identifying potential hazard scenarios and using USGS hazards science, federal, state, and local agencies can mitigate risk. For example, USGS science can be combined with population distribution to inform evacuation routes; local building and land-use codes to reduce impacts to critical facilities; emergency preparedness plans to ensure appropriate steps are taken before, during, and after an event. In addition, USGS science can inform large infrastructure investments – such as dams and reservoirs – and improvements to private property standards and materials, which all help to make homes and community structures more resilient to natural hazards.
Earthquakes
Earthquake hazards are a national, with nearly half of Americans living in areas prone to potentially damaging earthquakes. The USGS has created and provides information and tools to support earthquake loss reduction for the country. These include hazard assessments, earthquake scenarios like the annual ShakeOut events and the HayWired scenario, comprehensive real-time earthquake monitoring and public preparedness handbooks.
Now, imagine if fire stations could be warned to open the firehouse doors before damaging seismic waves of an earthquake arrive; if emergency responders were provided a few moments of advance notice to act; if trains could be slowed or stopped; if water and other utilities could be notified to protect services; and people could have time to "drop, cover and hold on." The USGS and its partners are making that a reality by building an Earthquake Early Warning System for the West Coast of the United States called ShakeAlert, and will begin the next phase of public warnings this fall. The system can provide vital seconds of warning before the arrival of strong shaking, providing valuable time for response and protective actions by people and automated systems.

Volcanoes
The United States is home to 161 active volcanoes across numerous Western states and territories. Volcanoes can show signs of unrest hours, days and months before they erupt. The USGS operates five Volcano Observatories to learn how volcanoes work and to detect and interpret these eruption precursors as part of the USGS National Volcano Early Warning System. By analyzing data from its monitoring networks, the USGS issues public warnings and alerts about potentially hazardous activity and current conditions at U.S. volcanoes, including forecasts of ashfall and notices of ash-forming eruptions to the aviation sector. The USGS works with emergency-management authorities well in advance of volcanic crises to raise the public’s awareness of volcanic hazards and to help potentially impacted communities prepare.
Volcanic activity has been very active this year, with low-level eruptions at Shishaldin continuing and unrest to low-level activity occurring at Cleveland and Semisopochnoi in the Aleutian Islands of Alaska. The USGS Hawaiian Volcano Observatory continues to monitor Mauna Loa that is exhibiting slightly elevated seismicity and deformation and post-eruptive changes at Kilauea on the island of Hawaii. The continuous monitoring of the Yellowstone “Supervolcano” and its active hydrothermal areas continues. There have been three recent steam and water explosions at Steamboat geysers at Yellowstone in August 2019 and a total of 33 steam explosions at Steamboat geyser this year, surpassing the number from 2018.

Hurricanes and Tsunamis
How vulnerable is your community to hurricanes, not just to wind but also to coastal erosion due to storm surge and waves, as well as inland flooding from extreme rainfall? USGS collects storm tide and high-water mark data for major hurricanes or tropical storms affecting the United States. The data is accessible to the public in the USGS Flood Event Viewer. In addition, the USGS assesses the likelihood of beach erosion, overwash, or inundation. The USGS provides real-time impacts of approaching storms via the Coastal Change Hazards Portal. This online tool allows anyone to interact with regularly updated forecasts of hurricane-induced coastal change, as well as “see” past, present and future hazards along the coastline from local to national-level scales.
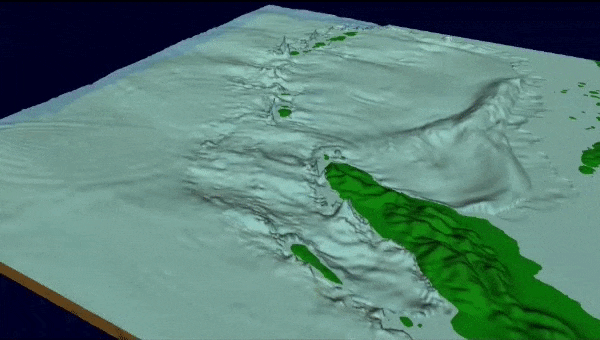
The USGS studies recent and historic tsunamis to better understand impacts, processes, and causes, with a focus on investigating earthquakes as triggers. USGS also studies landslide and volcanic eruption-triggered tsunamis to understand all potential causes and to identify tsunamis hazard zones. Scientists have evaluated the number of people or businesses exposed to tsunami hazards, as well as demographics and evacuation time for each of these communities. This provides officials with the ability to develop outreach, preparedness, and evacuation plans that are tailored to local conditions and needs.
Floods and Drought
The USGS operates a nationwide streamgage network to monitor water level and flow in rivers and streams and compiles flood-frequency information needed to design dams, bridges and other infrastructure, as well as to delineate floodplains. The same network provides data 24/7 to permit assessment of river flow conditions and for the National Weather Service flood forecasts, watches and warnings and the timing of flood-control reservoir retention or release of incoming flood waters to prevent downstream flooding. At the heart of USGS streamgaging operations are simple water-level/streamflow relations (rating curves) which permit the USGS to transform water-level data that can be easily monitored at each streamgage into the more complicated streamflow-volume data needed by forecasters and reservoir managers. Because these relations are functions of the stream channel, its size, shape, slope, and roughness, and because channels are greatly altered by flood flows, the USGS must maintain the ratings and keep them up to date. Otherwise, the reliability of the river forecasts and reservoir operations will degrade. The USGS deploys stream hydrographers (scientists, engineers, and technicians trained in hydrography) to directly measure the flood flows and adjust the ratings during and after the flood.

USGS science contributes to the U.S. Drought Monitor as well as the Drought Outlook led by NOAA’s NWS. Both the USGS streamgage network and the USGS ground-water network provide much of the base data. On a global scale, the Famine Early Warning Systems Network identifies populations with the most food insecurity. This network is an activity of the U.S. Agency for International Development, with the USGS serving as an implementing partner.

Landslides and Sinkholes
Landslides occur in all 50 states, and every year cause loss of life and billions of dollars in damage to public and private property. USGS science is helping assess where, when, and how often landslides occur and how fast and far they might move. For example, USGS scientists produce maps showing where landslides might occur and they identify what sort of rainfall conditions cause them. In southern California, the USGS partners with NOAA’s NWS to provide important advance warnings for debris-flows generated in areas burned by wildfire.
About 20 percent of the nation is at risk from sinkholes. These areas are underlain by karst, which is characterized by terrain where the underlying rock is easily dissolved by groundwater (check out more information on sinkholes at the USGS Water Science School). The USGS produces geologic and subsurface maps that help managers and others to better understand karst regions and identify local areas that may be susceptible.

Wildfires
The USGS provides tools and information before, during, and after fire disasters to identify wildfire risks and reduce subsequent hazards, including delivery to fire managers of up-to-the minute maps and satellite imagery about current wildfire extent and behavior.

Geomagnetic Storms
Geomagnetic storms are caused by a dynamic interaction between the solar wind and the Earth’s magnetic field. The resulting rapid magnetic field fluctuations can interfere with radio communications, GPS systems, satellites and directional drilling for oil and gas. Large magnetic storms can even interfere with the operations of electric power grids, causing blackouts. For these reasons, these storms are considered hazardous for both the economy and national security.
The USGS operates a network of specially designed observatories that provide real-time data on magnetic storm conditions. These data are critical for tracking the intensity of geomagnetic storms and are used by the NOAA Space Weather Prediction Center for issuing storm warnings, and likewise by the U.S. Air Force for their operations. Through the National Space Weather Program, USGS scientists are working with other federal government agencies and private industry to assess and mitigate hazardous effects of storms to the nation’s electric power grid.

Preparedness Resources
Get useful information and tools for preparing your family for hazards in your neighborhood, school, and workplace. FEMA’s Ready.gov website has ideas for creating emergency kits, activities for drills, group discussions, and exercises, and preparedness information specific to different hazards ranging from hurricanes to extreme heat.
The Great ShakeOut on October 17
Millions of people across the nation will be participating in the next ShakeOut earthquake preparedness drill, to be held on Oct. 17, 2019. At 10:17 a.m. local time, participants will “drop, cover and hold on.” Mark your calendar and sign up to join.
Resources for Further Information – Knowing how hazard risks can impact your area helps keep you and your family safe. Take a few minutes to click on the links below for more information and to sign up for applicable alerts to keep you informed at a moment’s notice.
Explore Your Hazards
- Coastal Hazards: See past, current and forecasted hazards along the coasts.
- Space Weather: Get details on the latest geomagnetic disturbance event caused by solar activity.
- Floods: Gather info on current flooding and past incidents at the USGS flood website.
- Drought: Browse through statistics on water use in the United States.
- Fire: See the Fire Danger Forecast, which is a dynamic map updated daily (at the top right, click “view legend for selected layer[s]” to see what the colors mean). If you live near a recent wildfire, see maps showing the potential for debris-flow activity.
- Wildlife die-off: Current and past wildlife die-off information is available online—through an interactive map—to help inform disease prevention and mitigation strategies.
- Tsunamis: An estimate of how long it would take for someone to travel by foot out of a tsunami-hazard zone can be calculated through the USGS Pedestrian Evacuation Analyst.
- Earthquakes: See the latest earthquakes worldwide.
Sign Up for Alerts
- Volcanoes: Sign up for free notification emails about volcanic activity happening at U.S. volcanoes.
- Water levels: See how high or low river levels are through USGS WaterWatch. Receive texts or emails when water levels in rivers and streams exceed certain thresholds through USGS WaterAlert. Or you can request data on-demand through USGS WaterNow.
- Earthquakes: Sign up to receive earthquake notices through the USGS Earthquake Notification System.
Along with the regular USGS Facebook page, our USGS Natural Hazards Science Facebook page is a great way to keep up-to-date with natural hazards, related science, and how we are working to keep our nation aware and prepared.
Related
ANSS - Advanced National Seismic System ANSS - Advanced National Seismic System

"Flood Hazards – A National Threat" Fact Sheet
Related
ANSS - Advanced National Seismic System ANSS - Advanced National Seismic System