Preliminary Analysis of Satellite Imagery and Seismic Observations of the Nuugaatsiaq Landslide and Tsunami, Greenland
Disclaimer
This information is preliminary or provisional and is subject to revision. It is being provided to meet the need for timely science to assess ongoing hazards. The information has not received final approval by the U.S. Geological Survey (USGS) and is provided on the condition that neither the USGS nor the U.S. Government shall be held liable for any damages resulting from the authorized or unauthorized use of the information.
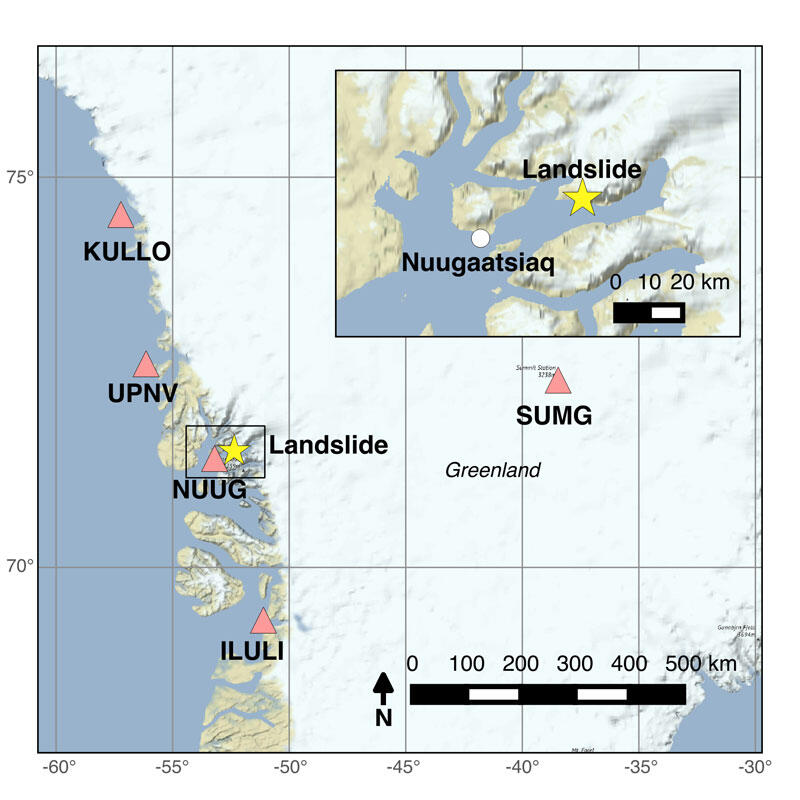
Around 10 pm local time on June 17th, 2017, a tsunami hit the community of Nuugaatsiaq, Greenland. Four people are presumed to have been killed and eleven homes were destroyed according to the Joint Arctic Command of the Danish Defense, who responded to the event, and media accounts. The Joint Arctic Command identified the likely source of the tsunami as a landslide that travelled into Uummannaq Fjord, approximately 32 kilometers northeast of Nuugaatsiaq (Figure 1). In an aerial overflight on 6/18, they also identified evidence of additional slope movement a few hundred meters west of the June 17th landslide scar. Photos and details are available on the Joint Arctic Command Facebook page. The landslide and tsunami generated a strong seismic signal. Additionally, pre- and post-event, high-resolution satellite imagery of the area is available. To provide timely scientific information regarding the event, we summarize our preliminary analysis of the imagery and seismic signals generated by the event that may help unravel the sequence of events leading up to and including the June 17th tsunami. Results could be helpful for identifying and understanding similar hazards in the region.
Satellite Imagery:
WorldView Imagery
Figure 2 shows the area of the June 17, 2017, Nuugaatsiaq landslide in pre-event images acquired on 5/16/16 and 6/5/17, and a post-event image from 6/22/17. Landslide features in two separate locations are visible in imagery that predates the Nuugaatsiaq landslide, which caused the tsunami on June 17, 2017. A scarp and deposit directly to the east of the Nuugaatsiaq landslide (labeled E in Figure 2 and henceforth referred to as the “East landslide”) appear in imagery dating back to 4/28/2011. Additionally, a scarp and tension cracks located approximately 1 km west of the Nuugaatsiaq landslide (labeled W in Figure 2 and henceforth referred to as the “West landslide”) are visible in imagery dating back to 5/16/16.
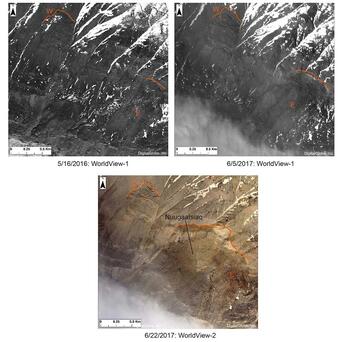
The East landslide occurred between 5/23/09 and 4/28/11 and evidence of movement can be observed from changes in imagery collected over the six-year period leading up to the June 17, 2017 slope failure. Between 2011 and 5/16/16 no major changes to the East landslide are visible in imagery. An Image from 6/5/17 shows enlargement of the landslide scarp and an increase in the amount of debris present on the slope. On 5/16/16 the scarp was ~315 m long (extending in the northwest/southeast direction) and the landslide deposit extended ~900 m down slope from the headscarp, covering an area of ~0.51 square km (source and deposit areas). On 6/5/17 the scarp of the East landslide was ~620 meters in length and the landslide covered an area of ~0.98 square km.
The image from 6/22/17 shows the scarp of the Nuugaatsiaq slide, which extended west from the scarp of the East landslide by an additional ~800 m. The scarp of the Nuugaatsiaq landslide is ~200 m higher in elevation than the East landslide scarp and water appears to be seeping from parts of the headscarp. The Nuugaatsiaq landslide appears to have partially cross-cut the East landslide. However, based on the unchanged location of several large boulders near the head of the East landslide deposit in pre- and post-images of the Nuugaatsiaq landslide, it appears that parts of the East landslide did not move during the June 17 failure. The total area covered by the East and Nuugaatsiaq landslides on 6/22/17 is ~2.01 square km.
The West landslide is visible in WorldView images from 5/16/16 and 6/5/17. It is not visible in WorldView images from 5/31/14 and 5/13/15. However, the area is partially covered by snow in the 2014 and 2015 images, so small features indicating movement may not be visible. Thus, substantial movement of the West landslide likely began between May 2015 and May 2016.
Landsat Imagery
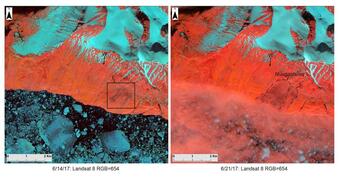
Landsat imagery from 6/14/17 (pre-event) and 6/21/17 (post-event) show the Nuugaastiaq, East (labeled E), and West (labeled W) landslides (Figure 3). False color composite images (RGB=564) were used to highlight changes in both images. In the image from 6/21/17, the Nuugaastiaq landslide deposit area appears as a darker shade of red in comparison to the surrounding slope. Similarly, both Landsat images show the deposit area of the East landslide in dark red.
Preliminary Differenced DEMs
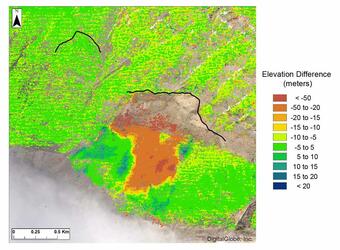
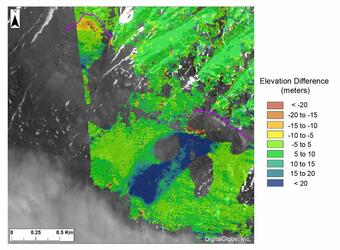
We used pre- and post-event Digital Elevation Models (DEMs) to examine elevation changes resulting from the Nuugaatsiaq landslide. We used NASA Ames Stereo Pipeline to produce 2-meter resolution DEMs from WorldView satellite stereo pairs collected on 6/5/17 (pre-event) and 6/22/17 (post-event). The resulting differenced elevation values (Figure 4) show a significant area of depletion directly below the Nuugaatsiaq headscarp and in the middle of the landslide. The volume of depleted material estimated from the differenced DEM is 18.7 million cubic meters. Poor correlation in extremely steep or shadowed areas during image matching results in areas of no data (holes) in the DEMs.
As shown in Figure 4, elevation data is missing in a ~320,000 square m hole directly below the Nuugaatsiaq headscarp. The differenced elevation values that are available in this hole provide an estimated thickness of as much as -165 m. Using 50 m and 100 m for the average thickness of depleted material in this hole provides an additional 16-32 million cubic meters of depleted material that is not included in the differenced DEM. Based on DEM differencing alone, we estimate that between 35-51 million cubic meters of material was involved in the Nuugaatsiaq landslide. The additional imagery of the area and information on the geometry and depth of the failure surface could be used to refine this estimate.
The volume of accumulated material measured from the differenced DEM is 1.6 million cubic meters. This does not account for the accumulation of material in areas of the landslide with net negative elevation changes or areas that appear as voids in the differenced DEM. However, the large difference between the amount of accumulation and depletion that we were able to estimate indicates that, at a minimum, 33.4 million cubic meters of material entered the fjord at the base of the slope.
DEM differences from images collected on 6/5/17 and 6/22/17 show no significant depletion or deposition at the East or West landslides during the June 17, 2017 event. However, we did identify elevation changes in both of these areas in a differenced DEM between 5/12/15 and 6/5/17 (Figure 5). The DEM from 5/12/15 was acquired from the Arctic DEM project and has a resolution of 2 meters. Elevation differences show an accumulation of material in the deposit area of the East landslide and an area of depletion near the scarp of the West landslide. Elevation differences in the East and West landslides coincide with visual observations made from WorldView images taken during the same time period.
Seismic Observations
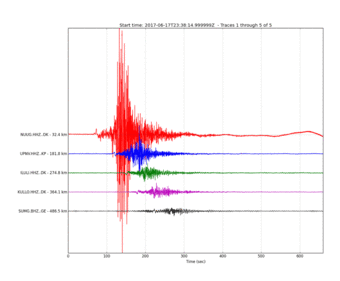
The landslide near Nuugaatsiaq generated strong seismic signals visible at low frequencies for thousands of km. For magnitude calculations, we used data from numerous stations at distances up to ~5500 km from the source area. For detailed seismic analysis, we examined seismic signals from the five closest stations for which data was available through IRIS web services. The locations of these stations are shown in Figure 1. The closest of the stations was NUUG, operated by the Danish Seismological Network (network id DK), located on the eastern edge of Nuugaatsiaq, the town affected by the tsunami, about 32 km from the landslide source area. The furthest we investigated in detail, SUMG, was located about 490 km from the landslide at the GEOFON Station Summit Camp (GE). We also used data from a station operated by the Korea Polar Seismic Network (KP), UPNV, which was the second closest station at 182 km.
General characteristics
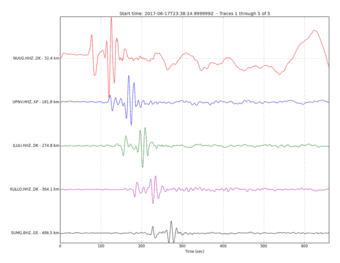
Initially, the seismic signals have characteristics typical of large rapid landslide seismic signals, with a long-period pulse visible starting prior to the appearance of the higher frequency energy (Figure 6). Unlike earthquakes where the first P and S wave arrivals can often be seen clearly and picked with relative accuracy for location and magnitude calculations, the higher frequency energy from landslides emerges gradually from the noise and no wave phases are clearly distinguishable. This characteristic makes the application of traditional source location methods challenging, and in some cases impossible. We do not see any characteristics in the seismic data, such as clear P and S wave arrivals, to suggest there was a triggering earthquake, so the observed signal is likely completely generated by the landslide and tsunami sequence itself.
The surface wave magnitude of the landslide signal was determined using surface waves recorded on stations between ~2000-5500 km from the event. The magnitude measurements were constrained to group velocity 2.7 - 4.2 km/s and a period window between 18 and 22 s. The final surface wave magnitude (Ms) value of 4.2 was determined using 164 measurements (Figure 7). Standard location techniques did not produce stable or accurate locations so the location was taken from satellite imagery showing the landslide source area and was not constrained by seismic data. The start time assigned was 2017-06-17 23:39:12 UTC, estimated from first arrival times of long period waves at the five closest stations. Results are posted on the USGS Earthquakes Hazards Program event page.
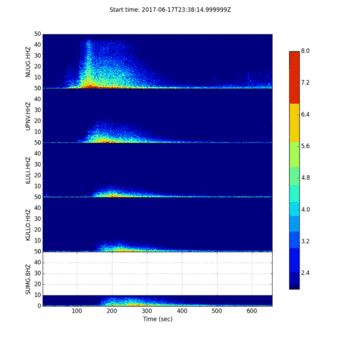
Higher frequency energy attenuates much more quickly with distance than low-frequency energy. Therefore the amplitude of the high-frequency energy at station NUUG dwarfs that of the more distant stations in Figure 6. The rapid attenuation of high-frequency energy is apparent on the spectrograms of those signals (Figure 8), which show the signal at NUUG had much broader spectral content (0-50 Hz). By the time the signal reaches the more distant stations, the energy is primarily below 10 Hz and mostly concentrated below 1 Hz.
Filtering the data to focus on the lower frequency energy (Figure 9) shows a coherent signal that is similar from station to station. This is typical of large rapid landslides. The long period energy is generated primarily by forces that the landslide exerts on the earth as the entire source mass accelerates and decelerates (Kanamori and Given 1982; Kawakatsu, 1989).
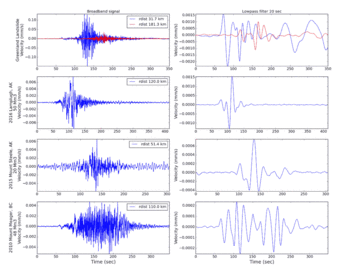
Comparing the signal from the Greenland landslide to that of other similarly large landslides (Figure 10) shows that while the general characteristics of the signal are very similar to that of other large landslides, the amplitudes at both high and low frequencies of this event are higher than that of the other events, even when recorded at similar distances. Particularly at higher frequencies, this may be because the Greenland event is located on a cold, stable, craton - part of the Precambrian Shield which is less attenuating compared to the other events which occurred in more highly attenuating tectonically active regions.
The low-frequency/long-period amplitudes are also higher than the other events (Figure 10, right column). The long period (10’s to 100’s of seconds) waveforms are dependent primarily on the magnitude and direction of the forces the bulk acceleration of the landslide mass exerts on the earth, which relates directly to the total mass times its acceleration (Kanamori and Given, 1982; Kawakatsu, 1989). However, the amplitudes at a given station are also dependent on the radiation pattern (and thus the direction of the landslide relative to the source to station azimuth), so a direct one-to-one comparison of amplitudes requires more careful analysis. A rough comparison shows that the amplitudes for all four big events (volumes of 20 to 50 million cubic meters, peak amplitudes of 0.2 to 1.5 x 10⁻⁶ m/s), are in the same general range, but the Greenland event is on the high end. The long-period amplitudes are comparable most closely in amplitude to those of the 2016 Lamplugh Glacier Landslide in Alaska, which had a volume of about 50 million cubic meters and initially traveled 1,150 vertical meters in a horizontal distance of 1000 meters (Bessette-Kirton, 2017). If we assume the landslide in Greenland was comparable in style, slope, and behavior to the other three, we can estimate its volume was probably also of the same order of magnitude, several tens of millions of cubic meters. This is consistent with our earlier estimate of 35-51 million cubic meters from pre- and post- DEM differencing.
Seismic signal related to the tsunami
The characteristic of the signal that makes the Greenland event distinct from many other landslide signals is the long period oscillatory signal that emerges strongly about 150 seconds after the first onset of the signal from the landslide (Figure 10, the upper right panel at 220 sec) at NUUG.
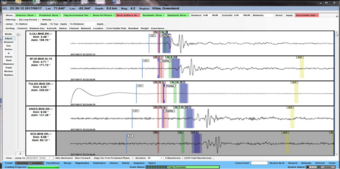
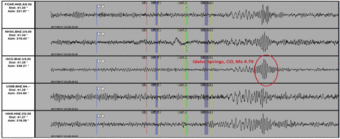
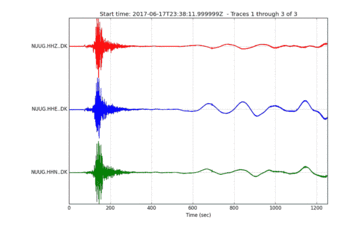
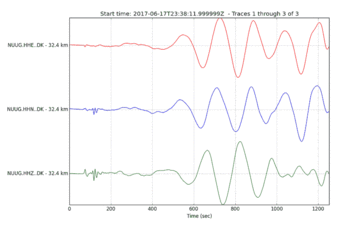
If we look more carefully and at a longer time period, we see that this oscillatory signal grows in amplitude and period on NUUG, starting at a period of ~100 sec and much lower amplitudes initially and growing to ~200 sec by about 8 minutes after the landslide initiation, 23:47:00 UTC, 9:47 pm local time (Figure 11 and 12). It’s possible that the initial oscillations may be generated by the forces exerted on the earth by the tsunami initiation in the fjord in the source area and the later oscillations may represent the tsunami arriving in NUUG, with the weight of the water causing the ground to move up and down by a seismically measurable amount. This is plausible because these later oscillations don’t appear on other stations. More detailed analysis and modeling are required to test the interpretation and to determine whether quantifiable information about the tsunami can be extracted from the seismic data. According to news reports, emergency services were called, around 10:15 pm local time, about half an hour after the first large oscillation at NUUG. The delay could indicate that the first waves were smaller, perhaps that the severity of the flooding didn’t become apparent immediately, or the ground tilt from the oncoming tsunami was detectable at NUUG before the first wave arrived onshore. At the time of this analysis (22 June 2017), data from NUUG was not available from after 23:59:59, likely due to power and/or telemetry loss due to the tsunami, but John Clinton of ETH Zurich and coauthors report on the IRIS special event page for this landslide that the data has since been recovered and the oscillations from waves at NUUG lasted for over three hours.
Summary
In summary, our analysis of satellite imagery and seismic signals indicates that the June 17, 2017 tsunami that impacted the town of Nuugaatsiaq was generated by a landslide. Satellite imagery reveals that several distinct landslides were present prior to the June 17th landslide. The East landslide, which was cross-cut by the June 17 Nuugaatsiaq landslide, occurred between May 2009 and May 2011. Movement of the East landslide was observed most recently between May 2016 and 6/5/17. The West landslide originated between May 2015 and May 2016 and remains perched on the hill slope above the fjord. If the West landslide were to fail catastrophically similar to the June 17 event, it could potentially generate a future tsunami. Future movement of the Nuugaatsiaq or East landslides could also have a similar effect. DEMs from before and after the Nuugaatsiaq landslide indicate that at a minimum, 35-51 million cubic meters of material was mobilized by the failure, the majority of which traveled into the fjord at the base of the slope and generated the tsunami. The seismic signals generated by the landslide have characteristics and amplitudes similar to other large rapid landslides with volumes of tens of millions of cubic meters. However, one difference is that in addition to the landslide signal, the seismic signals appear to also show seismic waves generated by the forces the tsunami exerted on the earth both in the source area and locally as waves arrived at Nuugaatsiaq.
Citation
Bessette-Kirton, Erin, Allstadt, Kate, Pursley, Jana, Godt, Jonathan, 2017, Preliminary Analysis of Satellite Imagery and Seismic Observations of the Nuugaatsiaq Landslide and Tsunami, Greenland, USGS Landslide Hazards Program Website, Preliminary Assessments, https://www.usgs.gov/natural-hazards/landslide-hazards/science/preliminary-analysis-satellite-imagery-and-seismic
References
- Bessette-Kirton, E., 2017, An Analysis of Landslide Volume, Structures, and Kinematics from Satellite Imagery of the 2016 Lamplugh Rock Avalanche, Glacier Bay National Park and Preserve, Alaska, M.S. Thesis, Colorado School of Mines.
- Kanamori, Hiroo and Given, J.W., 1982, Analysis of Long-period Seismic Waves Excited by the May 18, 1980, Eruption of Mount St. Helens - A Terrestrial Monopole?: Journal of Geophysical Research, v. 87, no. B7, p. 5422-5432.
- Kawakatsu, Hitoshi, 1989, Centroid Single Force Inversion of Seismic Waves Generated by Landslides: Journal of Geophysical Research, v. 94, no. B9, p 12,363-12,374.
Below are publications associated with this project.
Hydra—The National Earthquake Information Center’s 24/7 seismic monitoring, analysis, catalog production, quality analysis, and special studies tool suite Hydra—The National Earthquake Information Center’s 24/7 seismic monitoring, analysis, catalog production, quality analysis, and special studies tool suite
Disclaimer
This information is preliminary or provisional and is subject to revision. It is being provided to meet the need for timely science to assess ongoing hazards. The information has not received final approval by the U.S. Geological Survey (USGS) and is provided on the condition that neither the USGS nor the U.S. Government shall be held liable for any damages resulting from the authorized or unauthorized use of the information.
Around 10 pm local time on June 17th, 2017, a tsunami hit the community of Nuugaatsiaq, Greenland. Four people are presumed to have been killed and eleven homes were destroyed according to the Joint Arctic Command of the Danish Defense, who responded to the event, and media accounts. The Joint Arctic Command identified the likely source of the tsunami as a landslide that travelled into Uummannaq Fjord, approximately 32 kilometers northeast of Nuugaatsiaq (Figure 1). In an aerial overflight on 6/18, they also identified evidence of additional slope movement a few hundred meters west of the June 17th landslide scar. Photos and details are available on the Joint Arctic Command Facebook page. The landslide and tsunami generated a strong seismic signal. Additionally, pre- and post-event, high-resolution satellite imagery of the area is available. To provide timely scientific information regarding the event, we summarize our preliminary analysis of the imagery and seismic signals generated by the event that may help unravel the sequence of events leading up to and including the June 17th tsunami. Results could be helpful for identifying and understanding similar hazards in the region.

Satellite Imagery:
WorldView Imagery
Figure 2 shows the area of the June 17, 2017, Nuugaatsiaq landslide in pre-event images acquired on 5/16/16 and 6/5/17, and a post-event image from 6/22/17. Landslide features in two separate locations are visible in imagery that predates the Nuugaatsiaq landslide, which caused the tsunami on June 17, 2017. A scarp and deposit directly to the east of the Nuugaatsiaq landslide (labeled E in Figure 2 and henceforth referred to as the “East landslide”) appear in imagery dating back to 4/28/2011. Additionally, a scarp and tension cracks located approximately 1 km west of the Nuugaatsiaq landslide (labeled W in Figure 2 and henceforth referred to as the “West landslide”) are visible in imagery dating back to 5/16/16.

The East landslide occurred between 5/23/09 and 4/28/11 and evidence of movement can be observed from changes in imagery collected over the six-year period leading up to the June 17, 2017 slope failure. Between 2011 and 5/16/16 no major changes to the East landslide are visible in imagery. An Image from 6/5/17 shows enlargement of the landslide scarp and an increase in the amount of debris present on the slope. On 5/16/16 the scarp was ~315 m long (extending in the northwest/southeast direction) and the landslide deposit extended ~900 m down slope from the headscarp, covering an area of ~0.51 square km (source and deposit areas). On 6/5/17 the scarp of the East landslide was ~620 meters in length and the landslide covered an area of ~0.98 square km.
The image from 6/22/17 shows the scarp of the Nuugaatsiaq slide, which extended west from the scarp of the East landslide by an additional ~800 m. The scarp of the Nuugaatsiaq landslide is ~200 m higher in elevation than the East landslide scarp and water appears to be seeping from parts of the headscarp. The Nuugaatsiaq landslide appears to have partially cross-cut the East landslide. However, based on the unchanged location of several large boulders near the head of the East landslide deposit in pre- and post-images of the Nuugaatsiaq landslide, it appears that parts of the East landslide did not move during the June 17 failure. The total area covered by the East and Nuugaatsiaq landslides on 6/22/17 is ~2.01 square km.
The West landslide is visible in WorldView images from 5/16/16 and 6/5/17. It is not visible in WorldView images from 5/31/14 and 5/13/15. However, the area is partially covered by snow in the 2014 and 2015 images, so small features indicating movement may not be visible. Thus, substantial movement of the West landslide likely began between May 2015 and May 2016.
Landsat Imagery
Landsat imagery from 6/14/17 (pre-event) and 6/21/17 (post-event) show the Nuugaastiaq, East (labeled E), and West (labeled W) landslides (Figure 3). False color composite images (RGB=564) were used to highlight changes in both images. In the image from 6/21/17, the Nuugaastiaq landslide deposit area appears as a darker shade of red in comparison to the surrounding slope. Similarly, both Landsat images show the deposit area of the East landslide in dark red.

Preliminary Differenced DEMs
We used pre- and post-event Digital Elevation Models (DEMs) to examine elevation changes resulting from the Nuugaatsiaq landslide. We used NASA Ames Stereo Pipeline to produce 2-meter resolution DEMs from WorldView satellite stereo pairs collected on 6/5/17 (pre-event) and 6/22/17 (post-event). The resulting differenced elevation values (Figure 4) show a significant area of depletion directly below the Nuugaatsiaq headscarp and in the middle of the landslide. The volume of depleted material estimated from the differenced DEM is 18.7 million cubic meters. Poor correlation in extremely steep or shadowed areas during image matching results in areas of no data (holes) in the DEMs.
As shown in Figure 4, elevation data is missing in a ~320,000 square m hole directly below the Nuugaatsiaq headscarp. The differenced elevation values that are available in this hole provide an estimated thickness of as much as -165 m. Using 50 m and 100 m for the average thickness of depleted material in this hole provides an additional 16-32 million cubic meters of depleted material that is not included in the differenced DEM. Based on DEM differencing alone, we estimate that between 35-51 million cubic meters of material was involved in the Nuugaatsiaq landslide. The additional imagery of the area and information on the geometry and depth of the failure surface could be used to refine this estimate.

The volume of accumulated material measured from the differenced DEM is 1.6 million cubic meters. This does not account for the accumulation of material in areas of the landslide with net negative elevation changes or areas that appear as voids in the differenced DEM. However, the large difference between the amount of accumulation and depletion that we were able to estimate indicates that, at a minimum, 33.4 million cubic meters of material entered the fjord at the base of the slope.
DEM differences from images collected on 6/5/17 and 6/22/17 show no significant depletion or deposition at the East or West landslides during the June 17, 2017 event. However, we did identify elevation changes in both of these areas in a differenced DEM between 5/12/15 and 6/5/17 (Figure 5). The DEM from 5/12/15 was acquired from the Arctic DEM project and has a resolution of 2 meters. Elevation differences show an accumulation of material in the deposit area of the East landslide and an area of depletion near the scarp of the West landslide. Elevation differences in the East and West landslides coincide with visual observations made from WorldView images taken during the same time period.

Seismic Observations
The landslide near Nuugaatsiaq generated strong seismic signals visible at low frequencies for thousands of km. For magnitude calculations, we used data from numerous stations at distances up to ~5500 km from the source area. For detailed seismic analysis, we examined seismic signals from the five closest stations for which data was available through IRIS web services. The locations of these stations are shown in Figure 1. The closest of the stations was NUUG, operated by the Danish Seismological Network (network id DK), located on the eastern edge of Nuugaatsiaq, the town affected by the tsunami, about 32 km from the landslide source area. The furthest we investigated in detail, SUMG, was located about 490 km from the landslide at the GEOFON Station Summit Camp (GE). We also used data from a station operated by the Korea Polar Seismic Network (KP), UPNV, which was the second closest station at 182 km.
General characteristics
Initially, the seismic signals have characteristics typical of large rapid landslide seismic signals, with a long-period pulse visible starting prior to the appearance of the higher frequency energy (Figure 6). Unlike earthquakes where the first P and S wave arrivals can often be seen clearly and picked with relative accuracy for location and magnitude calculations, the higher frequency energy from landslides emerges gradually from the noise and no wave phases are clearly distinguishable. This characteristic makes the application of traditional source location methods challenging, and in some cases impossible. We do not see any characteristics in the seismic data, such as clear P and S wave arrivals, to suggest there was a triggering earthquake, so the observed signal is likely completely generated by the landslide and tsunami sequence itself.

The surface wave magnitude of the landslide signal was determined using surface waves recorded on stations between ~2000-5500 km from the event. The magnitude measurements were constrained to group velocity 2.7 - 4.2 km/s and a period window between 18 and 22 s. The final surface wave magnitude (Ms) value of 4.2 was determined using 164 measurements (Figure 7). Standard location techniques did not produce stable or accurate locations so the location was taken from satellite imagery showing the landslide source area and was not constrained by seismic data. The start time assigned was 2017-06-17 23:39:12 UTC, estimated from first arrival times of long period waves at the five closest stations. Results are posted on the USGS Earthquakes Hazards Program event page.


Higher frequency energy attenuates much more quickly with distance than low-frequency energy. Therefore the amplitude of the high-frequency energy at station NUUG dwarfs that of the more distant stations in Figure 6. The rapid attenuation of high-frequency energy is apparent on the spectrograms of those signals (Figure 8), which show the signal at NUUG had much broader spectral content (0-50 Hz). By the time the signal reaches the more distant stations, the energy is primarily below 10 Hz and mostly concentrated below 1 Hz.


Filtering the data to focus on the lower frequency energy (Figure 9) shows a coherent signal that is similar from station to station. This is typical of large rapid landslides. The long period energy is generated primarily by forces that the landslide exerts on the earth as the entire source mass accelerates and decelerates (Kanamori and Given 1982; Kawakatsu, 1989).
Comparing the signal from the Greenland landslide to that of other similarly large landslides (Figure 10) shows that while the general characteristics of the signal are very similar to that of other large landslides, the amplitudes at both high and low frequencies of this event are higher than that of the other events, even when recorded at similar distances. Particularly at higher frequencies, this may be because the Greenland event is located on a cold, stable, craton - part of the Precambrian Shield which is less attenuating compared to the other events which occurred in more highly attenuating tectonically active regions.
The low-frequency/long-period amplitudes are also higher than the other events (Figure 10, right column). The long period (10’s to 100’s of seconds) waveforms are dependent primarily on the magnitude and direction of the forces the bulk acceleration of the landslide mass exerts on the earth, which relates directly to the total mass times its acceleration (Kanamori and Given, 1982; Kawakatsu, 1989). However, the amplitudes at a given station are also dependent on the radiation pattern (and thus the direction of the landslide relative to the source to station azimuth), so a direct one-to-one comparison of amplitudes requires more careful analysis. A rough comparison shows that the amplitudes for all four big events (volumes of 20 to 50 million cubic meters, peak amplitudes of 0.2 to 1.5 x 10⁻⁶ m/s), are in the same general range, but the Greenland event is on the high end. The long-period amplitudes are comparable most closely in amplitude to those of the 2016 Lamplugh Glacier Landslide in Alaska, which had a volume of about 50 million cubic meters and initially traveled 1,150 vertical meters in a horizontal distance of 1000 meters (Bessette-Kirton, 2017). If we assume the landslide in Greenland was comparable in style, slope, and behavior to the other three, we can estimate its volume was probably also of the same order of magnitude, several tens of millions of cubic meters. This is consistent with our earlier estimate of 35-51 million cubic meters from pre- and post- DEM differencing.

Seismic signal related to the tsunami
The characteristic of the signal that makes the Greenland event distinct from many other landslide signals is the long period oscillatory signal that emerges strongly about 150 seconds after the first onset of the signal from the landslide (Figure 10, the upper right panel at 220 sec) at NUUG.
If we look more carefully and at a longer time period, we see that this oscillatory signal grows in amplitude and period on NUUG, starting at a period of ~100 sec and much lower amplitudes initially and growing to ~200 sec by about 8 minutes after the landslide initiation, 23:47:00 UTC, 9:47 pm local time (Figure 11 and 12). It’s possible that the initial oscillations may be generated by the forces exerted on the earth by the tsunami initiation in the fjord in the source area and the later oscillations may represent the tsunami arriving in NUUG, with the weight of the water causing the ground to move up and down by a seismically measurable amount. This is plausible because these later oscillations don’t appear on other stations. More detailed analysis and modeling are required to test the interpretation and to determine whether quantifiable information about the tsunami can be extracted from the seismic data. According to news reports, emergency services were called, around 10:15 pm local time, about half an hour after the first large oscillation at NUUG. The delay could indicate that the first waves were smaller, perhaps that the severity of the flooding didn’t become apparent immediately, or the ground tilt from the oncoming tsunami was detectable at NUUG before the first wave arrived onshore. At the time of this analysis (22 June 2017), data from NUUG was not available from after 23:59:59, likely due to power and/or telemetry loss due to the tsunami, but John Clinton of ETH Zurich and coauthors report on the IRIS special event page for this landslide that the data has since been recovered and the oscillations from waves at NUUG lasted for over three hours.


Summary
In summary, our analysis of satellite imagery and seismic signals indicates that the June 17, 2017 tsunami that impacted the town of Nuugaatsiaq was generated by a landslide. Satellite imagery reveals that several distinct landslides were present prior to the June 17th landslide. The East landslide, which was cross-cut by the June 17 Nuugaatsiaq landslide, occurred between May 2009 and May 2011. Movement of the East landslide was observed most recently between May 2016 and 6/5/17. The West landslide originated between May 2015 and May 2016 and remains perched on the hill slope above the fjord. If the West landslide were to fail catastrophically similar to the June 17 event, it could potentially generate a future tsunami. Future movement of the Nuugaatsiaq or East landslides could also have a similar effect. DEMs from before and after the Nuugaatsiaq landslide indicate that at a minimum, 35-51 million cubic meters of material was mobilized by the failure, the majority of which traveled into the fjord at the base of the slope and generated the tsunami. The seismic signals generated by the landslide have characteristics and amplitudes similar to other large rapid landslides with volumes of tens of millions of cubic meters. However, one difference is that in addition to the landslide signal, the seismic signals appear to also show seismic waves generated by the forces the tsunami exerted on the earth both in the source area and locally as waves arrived at Nuugaatsiaq.
Citation
Bessette-Kirton, Erin, Allstadt, Kate, Pursley, Jana, Godt, Jonathan, 2017, Preliminary Analysis of Satellite Imagery and Seismic Observations of the Nuugaatsiaq Landslide and Tsunami, Greenland, USGS Landslide Hazards Program Website, Preliminary Assessments, https://www.usgs.gov/natural-hazards/landslide-hazards/science/preliminary-analysis-satellite-imagery-and-seismic
References
- Bessette-Kirton, E., 2017, An Analysis of Landslide Volume, Structures, and Kinematics from Satellite Imagery of the 2016 Lamplugh Rock Avalanche, Glacier Bay National Park and Preserve, Alaska, M.S. Thesis, Colorado School of Mines.
- Kanamori, Hiroo and Given, J.W., 1982, Analysis of Long-period Seismic Waves Excited by the May 18, 1980, Eruption of Mount St. Helens - A Terrestrial Monopole?: Journal of Geophysical Research, v. 87, no. B7, p. 5422-5432.
- Kawakatsu, Hitoshi, 1989, Centroid Single Force Inversion of Seismic Waves Generated by Landslides: Journal of Geophysical Research, v. 94, no. B9, p 12,363-12,374.
Below are publications associated with this project.

