
The scientific background information for Emergency Assessment of Postfire Debris-Flow Hazards.
The preliminary hazard assessment relies upon empirical models to estimate the likelihood and volume of debris flows for selected basins in response to a design storm. Beginning in 2016, the empirical models are based upon historical debris–flow occurrence and magnitude data, rainfall storm conditions, terrain and soils information, and burn–severity data from recently burned areas (Staley et al., 2016, 2017). Hazard assessments for fires prior to May 2016 relied upon an earlier set of empirical methods described here.
The post-fire debris-flow likelihood, volume, and combined hazards are estimated at both the drainage-basin scale and in a spatially distributed manner along the drainage network within each basin. The characteristics of basins affected by the fire were calculated using a geographic information system (GIS). Debris-flow likelihood and volume were estimated for each basin outlet as well as along the upstream drainage networks (pixels where the contributing area is greater than or equal to 0.02 km2). Independent variable values were calculated for each pixel along the drainage network and summarized at the stream segment scale to obtain estimates of debris-flow likelihood and volume.
Required input data include a differenced normalized burn ratio image (dNBR), and field-validated soil burn severity data. If field-validated soil burn severity data are unavailable, it is possible to use a Burned Area Reflectance Classification (BARC4) image in substitution. Please note that the use of BARC4 data increases the degree of uncertainty in the model estimates.
Likelihood Model
The likelihood of a debris-flow in response to a given peak 15-minute rainfall intensity are based upon a logistic regression approach, which combines the following two equations:
(1) P = ex / (1 + ex)
Where
- P is the probability of debris-flow occurrence in fractional form, and
- ex is the exponential function where e represents the mathematical constant 2.718.
For recently burned areas in the western United States, equation 2 is used to calculate x:
(2) x = -3.63 + (0.41 × X1R) + (0.67 × X2R) + (0.7 × X3R)
Where
- X1R is the proportion of upslope area classified as high or moderate soil burn severity and with gradients ≥ 23°, multiplied by the peak 15-minute rainfall accumulation of the design storm (in millimeters [mm]),
- X2R is the average differenced normalized burn ratio (dNBR) of the upslope area, multiplied by the peak 15-minute rainfall accumulation of the design storm (in millimeters [mm]),
- X3R is the soil KF-Factor (Schwartz and Alexander, 1995) of the upslope area, multiplied by the peak 15-minute rainfall accumulation of the design storm (in millimeters [mm]).
Likelihood values predicted by the equation potentially range from 0 (least likely) to 1 (most likely). The predicted likelihood values are assigned to 1 of 5 equal interval classes for cartographic display and are represented as a percentage likelihood (rather than a ratio).
Volume Model
Debris-flow volumes both at the basin outlet and along the drainage network are predicted using a multiple linear regression model (Gartner and others, 2014). The multiple linear regression models are used to estimate the volume (V, in m3) of material that could issue from a point along the drainage network in response to a storm of a given rainfall intensity.
Potential debris-flow volume is calculated with equation 4:
(3) ln(V) = 4.22 + (0.13 × sqrt(ElevRange)) + (0.36 × ln(HMkm)) + (0.39 × sqrt(i15))
Where
- ElevRange is the range (maximum elevation–minimum elevation) of elevation values within the upstream watershed (in meters),
- HMkm is the area upstream of the calculation point that was burned at high or moderate severity (in km2), and
- i15 is the spatially-averaged peak 15-min rainfall intensity for the design storm in the upstream watershed (in mm/h).
Volume estimates were classified in order of magnitude scale ranges 0–1,000 m3; 1,000–10,000 m3; 10,000–100,000 m3; and greater than 100,000 m3 for cartographic display.
Combined Hazard
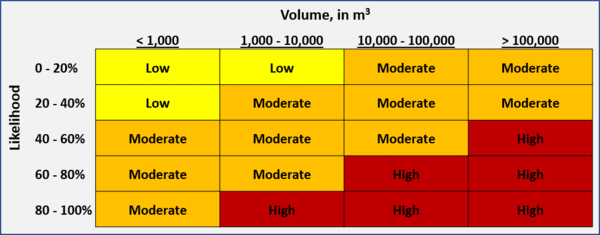
Debris-flow hazards from a given basin can be considered as the combination of both probability and volume. For example, in a given setting, the most hazardous basins will show both a high probability of occurrence and a large estimated volume of material. Slightly less hazardous would be basins that show a combination of either relatively low probabilities and larger volume estimates or high probabilities and smaller volume estimates. The lowest relative hazard would be for basins that show both low probabilities and the smallest volumes.
We combined the results of the probability and the volume maps following the methods of Cannon and others (2010). A rank of 1 to 5 (with 5 being the highest) is assigned to each of the probability classes, and a rank of 1 to 4 is assigned to each of the volume classes. The ranks of the probability and volume classes are then added together to produce a map of the combined relative hazard ranking for each basin (with 9 being the highest combined hazard). The table below illustrates how the combined relative hazard ranking is determined.
References
- Cannon, Susan H., et al. "Predicting the probability and volume of postwildfire debris flows in the intermountain western United States." Bulletin 122.1-2 (2010): 127-144.
- Gartner, Joseph E., Susan H. Cannon, and Paul M. Santi. "Empirical models for predicting volumes of sediment deposited by debris flows and sediment-laden floods in the transverse ranges of southern California." Engineering Geology 176 (2014): 45-56.
- Schwartz, G.E., and Alexander, R.B., 1995, Soils data for the conterminous United States derived from the NRCS State Soil Geographic (STATSGO) Database: U.S. Geological Survey Open-File Report 95–449, accessed July 2013, article
- Staley, Dennis M., et al. Updated logistic regression equations for the calculation of post-fire debris-flow likelihood in the western United States. No. 2016-1106. US Geological Survey, 2016.
- Staley, Dennis M., et al. "Prediction of spatially explicit rainfall intensity–duration thresholds for post-fire debris-flow generation in the western United States." Geomorphology 278 (2017): 149-162.
The scientific background information for Emergency Assessment of Postfire Debris-Flow Hazards.
The preliminary hazard assessment relies upon empirical models to estimate the likelihood and volume of debris flows for selected basins in response to a design storm. Beginning in 2016, the empirical models are based upon historical debris–flow occurrence and magnitude data, rainfall storm conditions, terrain and soils information, and burn–severity data from recently burned areas (Staley et al., 2016, 2017). Hazard assessments for fires prior to May 2016 relied upon an earlier set of empirical methods described here.
The post-fire debris-flow likelihood, volume, and combined hazards are estimated at both the drainage-basin scale and in a spatially distributed manner along the drainage network within each basin. The characteristics of basins affected by the fire were calculated using a geographic information system (GIS). Debris-flow likelihood and volume were estimated for each basin outlet as well as along the upstream drainage networks (pixels where the contributing area is greater than or equal to 0.02 km2). Independent variable values were calculated for each pixel along the drainage network and summarized at the stream segment scale to obtain estimates of debris-flow likelihood and volume.
Required input data include a differenced normalized burn ratio image (dNBR), and field-validated soil burn severity data. If field-validated soil burn severity data are unavailable, it is possible to use a Burned Area Reflectance Classification (BARC4) image in substitution. Please note that the use of BARC4 data increases the degree of uncertainty in the model estimates.
Likelihood Model
The likelihood of a debris-flow in response to a given peak 15-minute rainfall intensity are based upon a logistic regression approach, which combines the following two equations:
(1) P = ex / (1 + ex)
Where
- P is the probability of debris-flow occurrence in fractional form, and
- ex is the exponential function where e represents the mathematical constant 2.718.
For recently burned areas in the western United States, equation 2 is used to calculate x:
(2) x = -3.63 + (0.41 × X1R) + (0.67 × X2R) + (0.7 × X3R)
Where
- X1R is the proportion of upslope area classified as high or moderate soil burn severity and with gradients ≥ 23°, multiplied by the peak 15-minute rainfall accumulation of the design storm (in millimeters [mm]),
- X2R is the average differenced normalized burn ratio (dNBR) of the upslope area, multiplied by the peak 15-minute rainfall accumulation of the design storm (in millimeters [mm]),
- X3R is the soil KF-Factor (Schwartz and Alexander, 1995) of the upslope area, multiplied by the peak 15-minute rainfall accumulation of the design storm (in millimeters [mm]).
Likelihood values predicted by the equation potentially range from 0 (least likely) to 1 (most likely). The predicted likelihood values are assigned to 1 of 5 equal interval classes for cartographic display and are represented as a percentage likelihood (rather than a ratio).
Volume Model
Debris-flow volumes both at the basin outlet and along the drainage network are predicted using a multiple linear regression model (Gartner and others, 2014). The multiple linear regression models are used to estimate the volume (V, in m3) of material that could issue from a point along the drainage network in response to a storm of a given rainfall intensity.
Potential debris-flow volume is calculated with equation 4:
(3) ln(V) = 4.22 + (0.13 × sqrt(ElevRange)) + (0.36 × ln(HMkm)) + (0.39 × sqrt(i15))
Where
- ElevRange is the range (maximum elevation–minimum elevation) of elevation values within the upstream watershed (in meters),
- HMkm is the area upstream of the calculation point that was burned at high or moderate severity (in km2), and
- i15 is the spatially-averaged peak 15-min rainfall intensity for the design storm in the upstream watershed (in mm/h).
Volume estimates were classified in order of magnitude scale ranges 0–1,000 m3; 1,000–10,000 m3; 10,000–100,000 m3; and greater than 100,000 m3 for cartographic display.
Combined Hazard
Debris-flow hazards from a given basin can be considered as the combination of both probability and volume. For example, in a given setting, the most hazardous basins will show both a high probability of occurrence and a large estimated volume of material. Slightly less hazardous would be basins that show a combination of either relatively low probabilities and larger volume estimates or high probabilities and smaller volume estimates. The lowest relative hazard would be for basins that show both low probabilities and the smallest volumes.
We combined the results of the probability and the volume maps following the methods of Cannon and others (2010). A rank of 1 to 5 (with 5 being the highest) is assigned to each of the probability classes, and a rank of 1 to 4 is assigned to each of the volume classes. The ranks of the probability and volume classes are then added together to produce a map of the combined relative hazard ranking for each basin (with 9 being the highest combined hazard). The table below illustrates how the combined relative hazard ranking is determined.
References
- Cannon, Susan H., et al. "Predicting the probability and volume of postwildfire debris flows in the intermountain western United States." Bulletin 122.1-2 (2010): 127-144.
- Gartner, Joseph E., Susan H. Cannon, and Paul M. Santi. "Empirical models for predicting volumes of sediment deposited by debris flows and sediment-laden floods in the transverse ranges of southern California." Engineering Geology 176 (2014): 45-56.
- Schwartz, G.E., and Alexander, R.B., 1995, Soils data for the conterminous United States derived from the NRCS State Soil Geographic (STATSGO) Database: U.S. Geological Survey Open-File Report 95–449, accessed July 2013, article
- Staley, Dennis M., et al. Updated logistic regression equations for the calculation of post-fire debris-flow likelihood in the western United States. No. 2016-1106. US Geological Survey, 2016.
- Staley, Dennis M., et al. "Prediction of spatially explicit rainfall intensity–duration thresholds for post-fire debris-flow generation in the western United States." Geomorphology 278 (2017): 149-162.