Recent monitoring data.
National Weather Service:
Forecast Relative to Cumulative Precipitation Threshold | Rainfall Intensity/Duration Threshold | Rainfall Intensity-Duration Index | Antecedent Wetness Index (AWI)
Bluff location:
Rainfall | Rainfall Relative to Threshold | Soil Water Content | Soil Suction | Water Levels | Battery
National Weather Service Rain Gauge Locations Near Seattle: National Weather Service Observations
Forecast Relative to Cumulative Precipitation Threshold
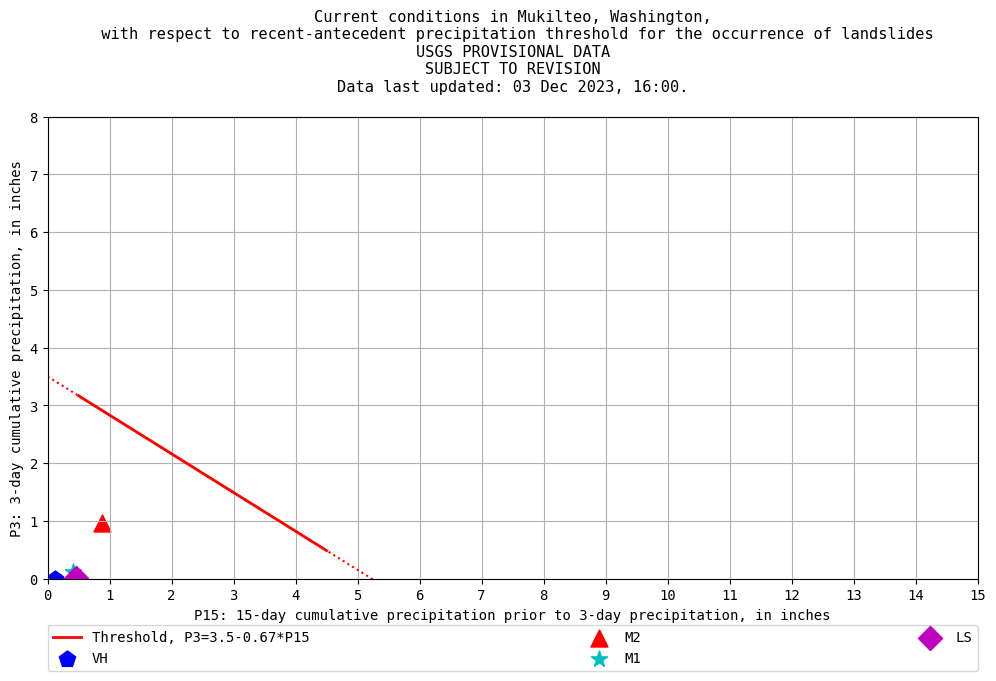
Graph shows cumulative precipitation threshold for landslides (red line) and the most recent and expected values of 3-day and prior 15-day cumulative precipitation at selected National Weather Service Gages (symbols). The expected values (faded symbols) are calculated from recent rainfall combined with the National Weather Service precipitation forecast. Landslides are likely to occur on days when precipitation totals exceed the threshold (plot above or to the right of the red line). Landslides are unlikely to occur when precipitation totals plot below the red line, in the lower left corner of graph. Please direct questions or comments regarding this information to Ben Mirus.

Rainfall Intensity/Duration Threshold
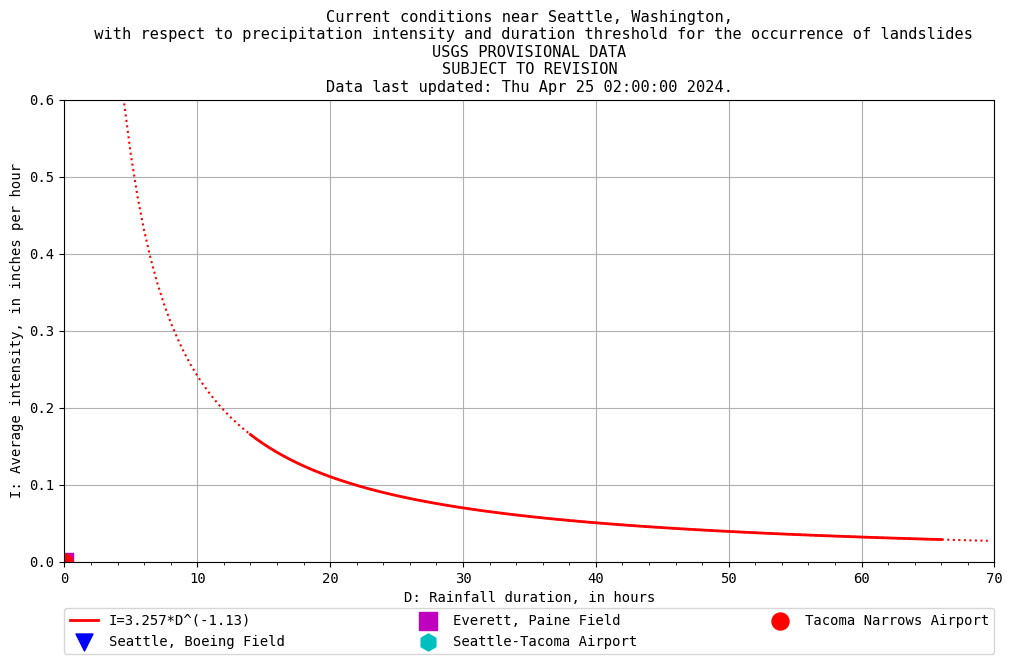
Graph shows rainfall intensity-duration threshold for landslides in the Seattle area (red line) and most recent update of rainfall intensity and duration at selected National Weather Service Rain Gages (Symbols). Landslides are very likely to occur when rainfall intensity plots above the red line. Please direct questions or comments regarding this information to Ben Mirus.
Rainfall Intensity-Duration Index
Graph shows conditions relative to the rainfall intensity-duration threshold for the last 14 days and the 24 hour forecast at selected National Weather Service Rain Gages (colored lines). The index is computed by dividing the current rainfall intensity by the intensity-duration threshold. When the colored lines are above the solid black line, the intensity-duration threshold has been exceeded and landslides are very likely. Please direct questions about or comments about this information to Ben Mirus.

Antecedent Wetness Index (AWI)
Graph shows the Antecedent Wetness Index (AWI) for landslides in the Seattle area for the last 14 days and 24-hour forecast at selected National Weather Service Rain Gages (colored lines). The AWI uses a water-balance approach to estimate whether soil is likely to be wet enough for landslides to occur as a result of additional, intense rainfall. Landslides are very likely to occur when the index plots above the black line and intense rainfall occurs (see graph for the rainfall intensity-duration threshold, above). Please direct questions or comments regarding this information to Ben Mirus.

Bluff Hydrology
The charts below show hillslope hydrologic data from a study on coastal bluffs in Mukilteo, Washington, North of Seattle. The study is being conducted in cooperation with Sound Transit . The purpose of the study is to improve understanding of conditions that lead to landslide occurrence in connection with rainfall. Instruments were installed in an active landslide area (LS) and in a presently vegetated coastal bluff (VH) that has potential for future landsliding. These stations are near Everett/Paine Field in the Field Layout map. The study is part of a larger effort to mitigate the effects of landslides on the coastal bluffs and thereby improve safety for rail passengers. For further information contact Ben Mirus.
Rainfall
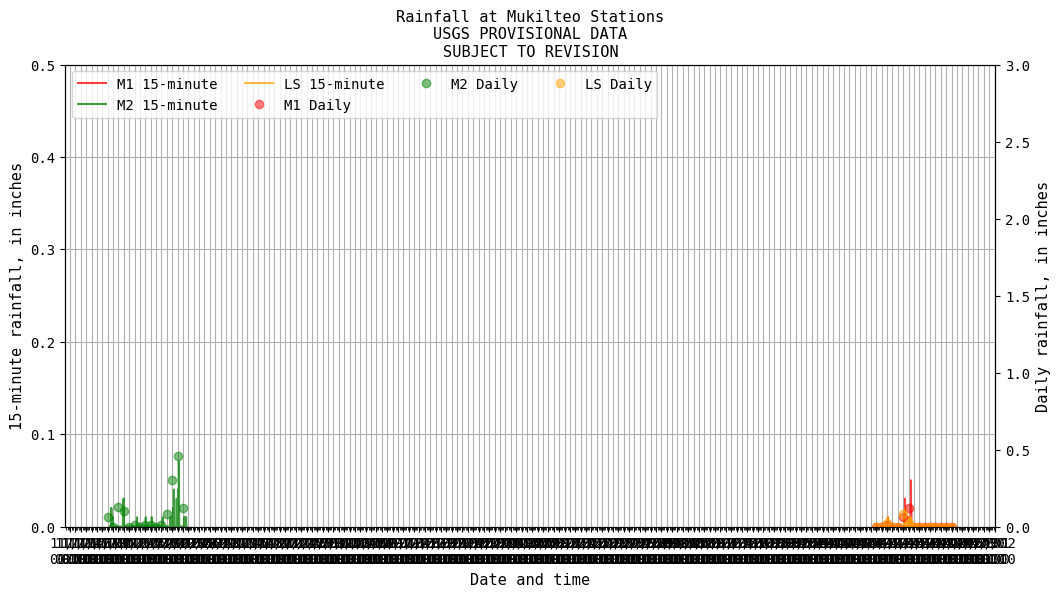
Rainfall is measured using tipping-bucket rain gauges at four locations along the west edge of Mukilteo.
Rainfall Relative to Threshold
Conditions relative to cumulative 3-day and previous 15-day threshold.
Soil Water Content
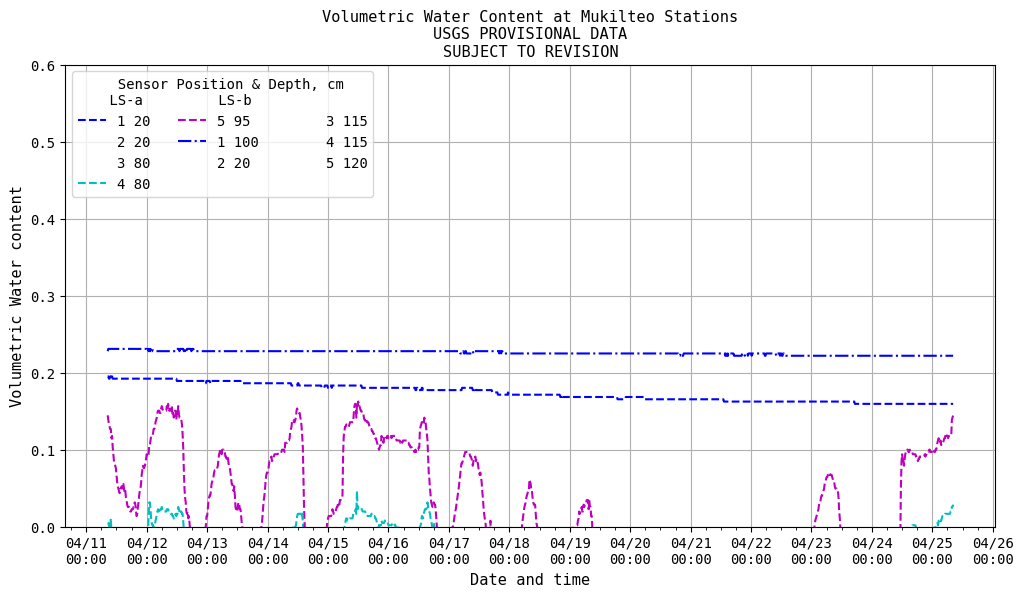
Volumetric water content of soil is measured using soil moisture sensors on profiles along the bluff in the active landslide area and stable bluff. Points are numbered from highest (1) to lowest (5).
Soil Suction
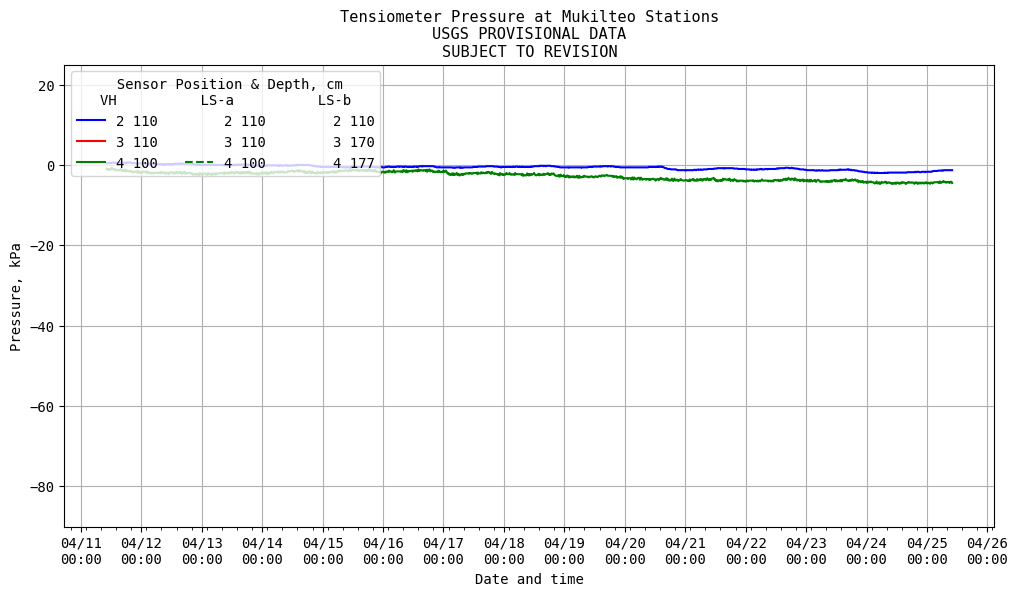
Soil suction (negative) is measured using tensiometers on profiles along the bluff in the active landslide area and stable bluff. The tensiometers are located near the three mid-bluff water content sensors (2, 3, 4).
Water Levels
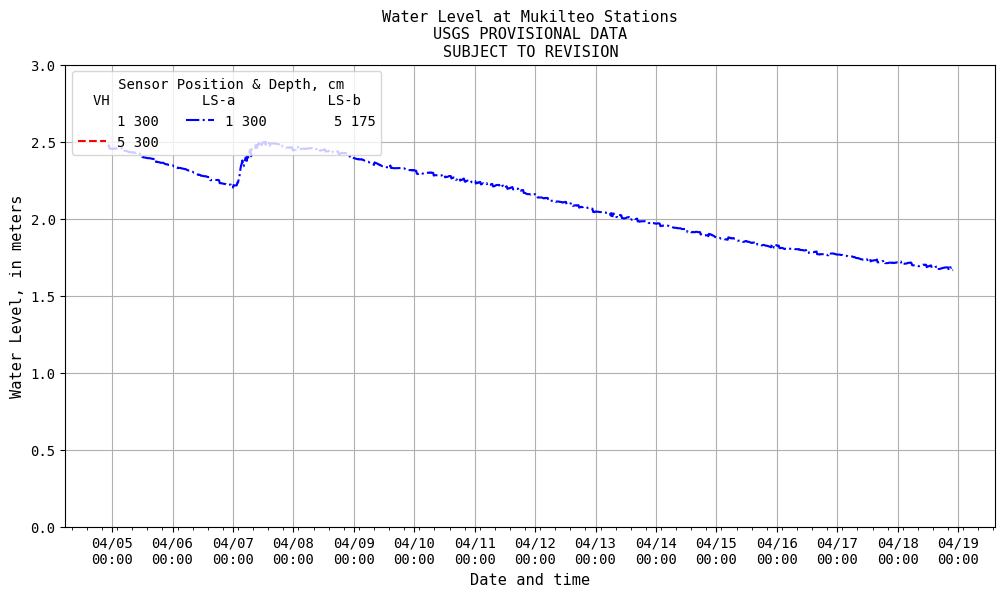
Water levels are measured using piezometers at the top and bottom of the profiles. The piezometers are located near the highest (1) and lowest (5) water content sensors.
Battery
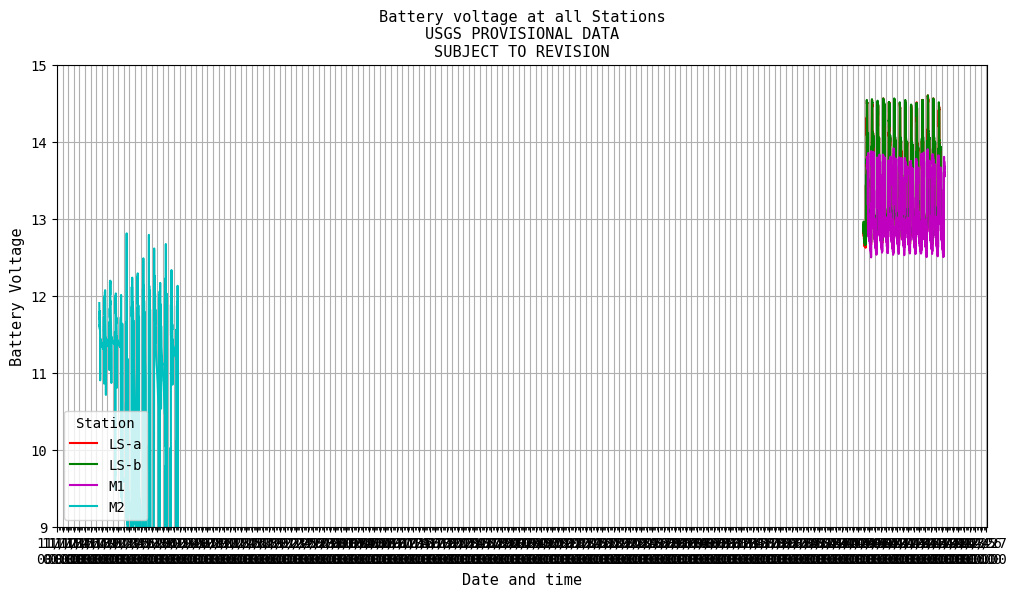
Battery voltages at each station.
Recent monitoring data.
National Weather Service:
Forecast Relative to Cumulative Precipitation Threshold | Rainfall Intensity/Duration Threshold | Rainfall Intensity-Duration Index | Antecedent Wetness Index (AWI)
Bluff location:
Rainfall | Rainfall Relative to Threshold | Soil Water Content | Soil Suction | Water Levels | Battery
National Weather Service Rain Gauge Locations Near Seattle: National Weather Service Observations
Forecast Relative to Cumulative Precipitation Threshold
Graph shows cumulative precipitation threshold for landslides (red line) and the most recent and expected values of 3-day and prior 15-day cumulative precipitation at selected National Weather Service Gages (symbols). The expected values (faded symbols) are calculated from recent rainfall combined with the National Weather Service precipitation forecast. Landslides are likely to occur on days when precipitation totals exceed the threshold (plot above or to the right of the red line). Landslides are unlikely to occur when precipitation totals plot below the red line, in the lower left corner of graph. Please direct questions or comments regarding this information to Ben Mirus.

Rainfall Intensity/Duration Threshold
Graph shows rainfall intensity-duration threshold for landslides in the Seattle area (red line) and most recent update of rainfall intensity and duration at selected National Weather Service Rain Gages (Symbols). Landslides are very likely to occur when rainfall intensity plots above the red line. Please direct questions or comments regarding this information to Ben Mirus.

Rainfall Intensity-Duration Index
Graph shows conditions relative to the rainfall intensity-duration threshold for the last 14 days and the 24 hour forecast at selected National Weather Service Rain Gages (colored lines). The index is computed by dividing the current rainfall intensity by the intensity-duration threshold. When the colored lines are above the solid black line, the intensity-duration threshold has been exceeded and landslides are very likely. Please direct questions about or comments about this information to Ben Mirus.

Antecedent Wetness Index (AWI)
Graph shows the Antecedent Wetness Index (AWI) for landslides in the Seattle area for the last 14 days and 24-hour forecast at selected National Weather Service Rain Gages (colored lines). The AWI uses a water-balance approach to estimate whether soil is likely to be wet enough for landslides to occur as a result of additional, intense rainfall. Landslides are very likely to occur when the index plots above the black line and intense rainfall occurs (see graph for the rainfall intensity-duration threshold, above). Please direct questions or comments regarding this information to Ben Mirus.

Bluff Hydrology
The charts below show hillslope hydrologic data from a study on coastal bluffs in Mukilteo, Washington, North of Seattle. The study is being conducted in cooperation with Sound Transit . The purpose of the study is to improve understanding of conditions that lead to landslide occurrence in connection with rainfall. Instruments were installed in an active landslide area (LS) and in a presently vegetated coastal bluff (VH) that has potential for future landsliding. These stations are near Everett/Paine Field in the Field Layout map. The study is part of a larger effort to mitigate the effects of landslides on the coastal bluffs and thereby improve safety for rail passengers. For further information contact Ben Mirus.
Rainfall
Rainfall is measured using tipping-bucket rain gauges at four locations along the west edge of Mukilteo.

Rainfall Relative to Threshold
Conditions relative to cumulative 3-day and previous 15-day threshold.

Soil Water Content
Volumetric water content of soil is measured using soil moisture sensors on profiles along the bluff in the active landslide area and stable bluff. Points are numbered from highest (1) to lowest (5).

Soil Suction
Soil suction (negative) is measured using tensiometers on profiles along the bluff in the active landslide area and stable bluff. The tensiometers are located near the three mid-bluff water content sensors (2, 3, 4).

Water Levels
Water levels are measured using piezometers at the top and bottom of the profiles. The piezometers are located near the highest (1) and lowest (5) water content sensors.

Battery
Battery voltages at each station.


