
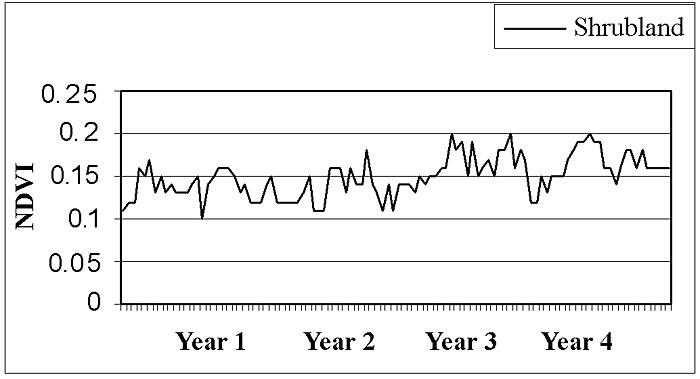
Regardless of the method used, it is difficult to create algorithms sufficiently robust to derive phenological metrics from certain types of real time-series NDVI curves (as opposed to modeled or simulated data). For example, in desert shrublands (see below), time series NDVI shows little seasonal amplitude. Ideally, algorithms should be able to identify these regions and assign them a value such as "no growing season."
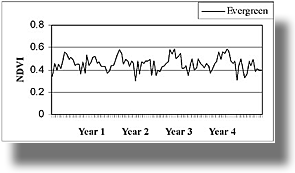
Some ecosystems with evergreen vegetation can have misleading NDVI signals. Right (top) is a time-series NDVI curve from an image pixel of spruce-fir-pine coniferous forest in Colorado's Rocky Mountains. The data show what looks like a seasonal signal, one that is similar to that of croplands that go from bare soil to thick vegetation cover. However, in this case the low winter NDVI values are likely the result of snow cover rather than a change in vegetation. Compare this with the NDVI curve from a pixel of fir-hemlock-pine forest in Oregon's Cascade Mountains (right middle), where the dense canopy exhibits less influence of snow cover. Perhaps the use of snow cover data, coupled with NDVI, could reduce the effects of snow on defining the seasonality of evergreen regions.

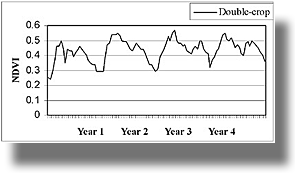
Finally, the NDVI curve right (bottom)—from a pixel of California's Imperial Valley—illustrates a region with two (double-crop) growing seasons each year. While areas with more than a single growing season are rare in the conterminous U.S., they are common in other parts of the world, including agricultural regions of Asia and Africa.
Depicting two annual growing seasons in remote sensing phenology is a challenge. Depending on the ultimate application of the derived metrics, the end-user may be interested in characterizing only the primary growing season, only the secondary season, or both. The curve derivative method we use currently provides information on only one season in such cases—typically the primary growing season (i.e., the one characterized by the largest maximum NDVI values).
Below are other science projects associated with this project.

Methods for Deriving Metrics

Validation
Methods for Deriving Metrics

Challenges in Deriving Phenological Metrics

Data Smoothing - Reducing the "Noise" in NDVI
Regardless of the method used, it is difficult to create algorithms sufficiently robust to derive phenological metrics from certain types of real time-series NDVI curves (as opposed to modeled or simulated data). For example, in desert shrublands (see below), time series NDVI shows little seasonal amplitude. Ideally, algorithms should be able to identify these regions and assign them a value such as "no growing season."
Some ecosystems with evergreen vegetation can have misleading NDVI signals. Right (top) is a time-series NDVI curve from an image pixel of spruce-fir-pine coniferous forest in Colorado's Rocky Mountains. The data show what looks like a seasonal signal, one that is similar to that of croplands that go from bare soil to thick vegetation cover. However, in this case the low winter NDVI values are likely the result of snow cover rather than a change in vegetation. Compare this with the NDVI curve from a pixel of fir-hemlock-pine forest in Oregon's Cascade Mountains (right middle), where the dense canopy exhibits less influence of snow cover. Perhaps the use of snow cover data, coupled with NDVI, could reduce the effects of snow on defining the seasonality of evergreen regions.
Finally, the NDVI curve right (bottom)—from a pixel of California's Imperial Valley—illustrates a region with two (double-crop) growing seasons each year. While areas with more than a single growing season are rare in the conterminous U.S., they are common in other parts of the world, including agricultural regions of Asia and Africa.
Depicting two annual growing seasons in remote sensing phenology is a challenge. Depending on the ultimate application of the derived metrics, the end-user may be interested in characterizing only the primary growing season, only the secondary season, or both. The curve derivative method we use currently provides information on only one season in such cases—typically the primary growing season (i.e., the one characterized by the largest maximum NDVI values).
Below are other science projects associated with this project.
Methods for Deriving Metrics
Validation
Methods for Deriving Metrics
Challenges in Deriving Phenological Metrics