

In this episode of Eyes on Earth, we talk about the latest release of the National Land Cover Database (NLCD). More than just a map, NLCD is a stack of maps—a database. It has long been the foundational land cover source for scientists, resource managers, and decision-makers across the United States, and now the next generation of USGS land cover mapping is here.
Jesslyn Brown
Jesslyn Brown is a research geographer with the U.S. Geological Survey (USGS) Earth Resources Observation and Science (EROS) Center in Sioux Falls, South Dakota, USA. Jess's main interests involve improving the understanding of changes in terrestrial vegetation, drought early warning, and transitions in land cover and land use by advancing the use of remote sensing imagery in applications.
Jesslyn Brown is a research geographer with the U.S. Geological Survey (USGS) Earth Resources Observation and Science (EROS) Center in Sioux Falls, South Dakota, USA, where she has worked over 30 years. Her work in applied geographic research has contributed to improving understanding of terrestrial vegetation patterns and advancing the use of remotely sensed imagery for applications including drought early warning, tracking vegetation phenology (i.e., seasonal dynamics), and mapping land cover and land use. In the 1990s, Jess was a member of the Global Land Cover Characteristics team that created the first map of global land cover at a 1-km resolution. From 2001 to 2017, she led multiple projects mainly focused on developing new monitoring tools, including VegDRI and QuickDRI, to improve agricultural drought monitoring capabilities in the U.S. in a strong collaboration with the University of Nebraska-Lincoln’s National Drought Mitigation Center. During that time, she also led efforts to investigate recent land use change specifically focused on irrigated agriculture across the country. In 2017, she began leading the Land Change Monitoring Assessment and Projection (LCMAP) science team. LCMAP was a USGS initiative to develop an end-to-end capability to use the deep Landsat record to continuously track and characterize changes in land cover state and condition and translate the information into assessments of current and historical processes of cover and change. In 2023, the LCMAP project was integrated with the National Land Cover Database team. Under Jess’s leadership, this team developed and produced a new annual land cover database for the conterminous U.S. covering 39 years from 1985 to 2023 utilizing the long Landsat record, deep learning methods, and cloud computing.
Science and Products
Filter Total Items: 38

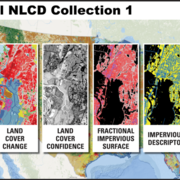
Annual NLCD Land Cover Confidence
The land cover confidence represents the probability value for the land cover class derived from the classification method.

Annual NLCD Spectral Change Day of Year
The Annual National Land Cover Database (NLCD) Spectral Change Day of Year product represents the day-of-year (DOY) on which a significant deviation in Landsat surface reflectance was detected within the calendar year of the map product. Spectral changes represent abrupt non-phenological changes in the reflectance of the land surface through time that may or may not be related to land cover change...

Annual NLCD Land Cover Classification
The primary NLCD land cover product represents the predominant thematic land cover class within the mapping year with respect to broad categories of artificial or natural surface cover.

Annual NLCD Land Cover Change
The Annual NLCD land cover change product represents annual land cover change between one product year and the next, with those changes represented in the latter year (e.g., differences in land cover between 1985 and 1986 are shown in the 1986 land cover change product). These differences are represented categorically in the product data by concatenating the before and after land cover class codes...

Annual NLCD Impervious Descriptor
The Annual National Land Cover Database (NLCD) Impervious Descriptor product represents categorical data for developed land cover distinguishing roads from urban non-road.

Annual NLCD Fractional Impervious Surface
The Annual National Land Cover Database (NLCD) impervious surface product represents the fractional surface area of the map unit (pixel) that is covered with artificial substrate or structures. This includes processed materials or structures (pavement, concrete, rooftops, and other constructed materials) that generate surface runoff. The majority of these materials are impervious to water, but...
Annual NLCD Product Suite
Annual National Land Cover Database (NLCD) Collection 1.2 includes a suite of six raster land use and land cover science products for the conterminous United States. It covers the period between 1985 and 2025. The Science Product User Guide contains in-depth background and documentation about the Annual NLCD product suite.

Annual NLCD Data Access
Annual National Land Cover Database (NLCD) has a variety of options for users to download data from including EarthExplorer, web-based visualization tools, USGS ScienceBase, AWS Cloud, and Mosaic Download sites. Follow the links below to explore which platform works best for your needs.

About Annual NLCD
Improving information on the characteristics of land cover, understanding the basic drivers of change, and identifying of potential consequences of change on human and natural systems can empower greater insight into the impacts and feedback of human activity and other drivers. To meet its needs, the geospatial community has called for a new generation of monitoring data and information as input...

Reference and Validation
The Annual NLCD Reference & Validation (R&V) is designed to support the development of consistent land cover and land cover change products and data. The R&V process involves collecting reference data to validate Anderson Level II land cover classes and change products across the United States. The R&V team gathers, organizes, and refines an independent reference datasets to generate validation...

Annual National Land Cover Database
Land cover is foundational information for land managers, scientists, and the general public. Many types of scientific studies have applied annual land cover information including projecting future land use, documenting forest fragmentation or conservation practices, modeling wildfire hazards, tracking water quality and quantity, and understanding change in wildlife habitat and ecosystem...

Multi-resolution Land Cover Characterization Consortium
The Multi-Resolution Land Characteristics (MRLC) Consortium, established over 20 years ago, is a group representing multiple federal agencies who coordinate and generate consistent and relevant land cover information at the national scale for a wide variety of environmental, land management, and modeling applications.
Participated in these Eyes on Earth podcast episodes.
In this episode of Eyes on Earth, we talk about the latest release of the National Land Cover Database (NLCD). More than just a map, NLCD is a stack of maps—a database. It has long been the foundational land cover source for scientists, resource managers, and decision-makers across the United States, and now the next generation of USGS land cover mapping is here.

Eyes on Earth Episode 106 – EROS 50th: Land Cover, Part 1
Eyes on Earth Episode 106 – EROS 50th: Land Cover, Part 1Several decades ago, USGS EROS employees were pioneers in land cover mapping—turning satellite imagery into a record of what covers the land, from farmland to forest to urban areas. National and global datasets with a variety of uses resulted from these efforts.

Eyes on Earth Episode 29 – Tracking Landscape Change with LCMAP
Eyes on Earth Episode 29 – Tracking Landscape Change with LCMAPThe U.S. Geological Survey took a bold step toward documenting change across the landscape with the launch of the first Landsat satellite in 1972. Since then, it’s collected nearly five decades of imagery. But it takes more than just imagery to understand change. It takes time, effort—and serious computing horsepower.

Eyes on Earth Episode 12 – Plant Health via Satellite (NDVI)
Eyes on Earth Episode 12 – Plant Health via Satellite (NDVI)A farmer at the foot of a corn stalk can tell how well the plant is faring. That same farmer might survey his entire field for crop health. But assessing the health of crops or forests at regional, national, and international scales requires remote sensing, most often via satellite.
Science and Products
Filter Total Items: 38
Annual NLCD Land Cover Confidence
The land cover confidence represents the probability value for the land cover class derived from the classification method.
Annual NLCD Spectral Change Day of Year
The Annual National Land Cover Database (NLCD) Spectral Change Day of Year product represents the day-of-year (DOY) on which a significant deviation in Landsat surface reflectance was detected within the calendar year of the map product. Spectral changes represent abrupt non-phenological changes in the reflectance of the land surface through time that may or may not be related to land cover change...
Annual NLCD Land Cover Classification
The primary NLCD land cover product represents the predominant thematic land cover class within the mapping year with respect to broad categories of artificial or natural surface cover.
Annual NLCD Land Cover Change
The Annual NLCD land cover change product represents annual land cover change between one product year and the next, with those changes represented in the latter year (e.g., differences in land cover between 1985 and 1986 are shown in the 1986 land cover change product). These differences are represented categorically in the product data by concatenating the before and after land cover class codes...
Annual NLCD Impervious Descriptor
The Annual National Land Cover Database (NLCD) Impervious Descriptor product represents categorical data for developed land cover distinguishing roads from urban non-road.
Annual NLCD Fractional Impervious Surface
The Annual National Land Cover Database (NLCD) impervious surface product represents the fractional surface area of the map unit (pixel) that is covered with artificial substrate or structures. This includes processed materials or structures (pavement, concrete, rooftops, and other constructed materials) that generate surface runoff. The majority of these materials are impervious to water, but...
Annual NLCD Product Suite
Annual National Land Cover Database (NLCD) Collection 1.2 includes a suite of six raster land use and land cover science products for the conterminous United States. It covers the period between 1985 and 2025. The Science Product User Guide contains in-depth background and documentation about the Annual NLCD product suite.
Annual NLCD Data Access
Annual National Land Cover Database (NLCD) has a variety of options for users to download data from including EarthExplorer, web-based visualization tools, USGS ScienceBase, AWS Cloud, and Mosaic Download sites. Follow the links below to explore which platform works best for your needs.
About Annual NLCD
Improving information on the characteristics of land cover, understanding the basic drivers of change, and identifying of potential consequences of change on human and natural systems can empower greater insight into the impacts and feedback of human activity and other drivers. To meet its needs, the geospatial community has called for a new generation of monitoring data and information as input...
Reference and Validation
The Annual NLCD Reference & Validation (R&V) is designed to support the development of consistent land cover and land cover change products and data. The R&V process involves collecting reference data to validate Anderson Level II land cover classes and change products across the United States. The R&V team gathers, organizes, and refines an independent reference datasets to generate validation...
Annual National Land Cover Database
Land cover is foundational information for land managers, scientists, and the general public. Many types of scientific studies have applied annual land cover information including projecting future land use, documenting forest fragmentation or conservation practices, modeling wildfire hazards, tracking water quality and quantity, and understanding change in wildlife habitat and ecosystem...
Multi-resolution Land Cover Characterization Consortium
The Multi-Resolution Land Characteristics (MRLC) Consortium, established over 20 years ago, is a group representing multiple federal agencies who coordinate and generate consistent and relevant land cover information at the national scale for a wide variety of environmental, land management, and modeling applications.
Participated in these Eyes on Earth podcast episodes.
Eyes on Earth Episode 126 – Annual NLCD
In this episode of Eyes on Earth, we talk about the latest release of the National Land Cover Database (NLCD). More than just a map, NLCD is a stack of maps—a database. It has long been the foundational land cover source for scientists, resource managers, and decision-makers across the United States, and now the next generation of USGS land cover mapping is here.
In this episode of Eyes on Earth, we talk about the latest release of the National Land Cover Database (NLCD). More than just a map, NLCD is a stack of maps—a database. It has long been the foundational land cover source for scientists, resource managers, and decision-makers across the United States, and now the next generation of USGS land cover mapping is here.
Eyes on Earth Episode 106 – EROS 50th: Land Cover, Part 1
Eyes on Earth Episode 106 – EROS 50th: Land Cover, Part 1Several decades ago, USGS EROS employees were pioneers in land cover mapping—turning satellite imagery into a record of what covers the land, from farmland to forest to urban areas. National and global datasets with a variety of uses resulted from these efforts.
Eyes on Earth Episode 29 – Tracking Landscape Change with LCMAP
Eyes on Earth Episode 29 – Tracking Landscape Change with LCMAPThe U.S. Geological Survey took a bold step toward documenting change across the landscape with the launch of the first Landsat satellite in 1972. Since then, it’s collected nearly five decades of imagery. But it takes more than just imagery to understand change. It takes time, effort—and serious computing horsepower.
Eyes on Earth Episode 12 – Plant Health via Satellite (NDVI)
Eyes on Earth Episode 12 – Plant Health via Satellite (NDVI)A farmer at the foot of a corn stalk can tell how well the plant is faring. That same farmer might survey his entire field for crop health. But assessing the health of crops or forests at regional, national, and international scales requires remote sensing, most often via satellite.