The USGS Storm Event dashboard allows users to interact with and visualize high-water mark and storm sensor data points, and estimated flood extents from the January and March 2018 Nor’easter storm events. Users can also view the USGS 100-year Stillwater analysisand compare these flood extents to the current FEMA national flood hazard layers.
Rena Kalmon
Rena Kalmon is a Physical Scientist in the New England Water Science Center.
Her work primarily focusses on flood risk assessments across New England.
Professional Experience
Physical Scientist, U.S. Geological Survey, New England Water Science Center, 2018 to Present
Hydrologic Technician (Student Trainee), U.S. Geological Survey, New England Water Science Center, 2017 to 2018
Education and Certifications
B.S. Hydrology, University of Wisconsin Stevens Point, 2018
Certificate in Geographic Information Systems, University of Wisconsin Stevens Point, 2018
Science and Products
Documentation and mapping of flooding from the January and March 2018 nor’easters in coastal New England
In January and March 2018, coastal Massachusetts experienced flooding from two separate nor’easters. To put the January and March floods into historical context, the USGS computed statistical stillwater elevations. Stillwater elevations recorded in January 2018 in Boston (9.66 feet relative to the North American Vertical Datum of 1988) have an annual exceedance probability of between 2 and 1 perce
Flood Documentation and Inundation Mapping of the January and March 2018 Nor’easters in Coastal Massachusetts
Data and shapefiles used to document the floods associated with the January and March 2018 Nor'easters for Coastal Areas of New England (ver. 2.0, November 2021)
The USGS Storm Event dashboard allows users to interact with and visualize high-water mark and storm sensor data points, and estimated flood extents from the January and March 2018 Nor’easter storm events. Users can also view the USGS 100-year Stillwater analysisand compare these flood extents to the current FEMA national flood hazard layers.
This lesson will cover Stream Flow Estimates in NHDPlus High Resolution. Enhanced Runoff Method, or EROM is the method used to compute estimates of the mean annual flow for the NHDPlus flowline features in the NHDPlus HR network.
Surface Water Modeling for FEMA Flood Insurance Rate Maps.
USGS employee in a canoe hold a prism and survey rod level while the channel point is collected with a total station from shore.
Surface Water Modeling for FEMA Flood Insurance Rate Maps.
USGS employee in a canoe hold a prism and survey rod level while the channel point is collected with a total station from shore.
Surface Water Modeling for FEMA Flood Insurance Rate Maps.
Hydrologic Technician Gunther Schletter takes a channel measurement using a Total Station on a river near St. Johnsbury, VT.
Surface Water Modeling for FEMA Flood Insurance Rate Maps.
Hydrologic Technician Gunther Schletter takes a channel measurement using a Total Station on a river near St. Johnsbury, VT.
In this lesson we will examine a brief history of the USGS topographic map, Introduce US Topo maps and their content, discuss the production and future goals of US Topo, and learn how to access these maps for viewing or printing.
By the end of this lesson, you will understand the difference between the LAS and LAZ format, know where to download the laszip.exe tool, and how to decompress a LAZ file to a LAS file using laszip.exe. The USGS offers other lessons on using LAS files in ArcGIS Pro, Global Mapper, and LP360.
In this lesson you will learn how to zoom to your area of interest and view the footprints of existing and proposed topographic lidar projects.
In this lesson you will learn how to use the USGS areas of interest project collection tool to add your lidar project to the Seasketch Demonstration Site for Federal Mapping Data Acquisition Coordination.
In this lesson you will learn how use the public areas of interest project collection tool to add your lidar project to the Seasketch Demonstration Site for Federal Mapping Data Acquisition Coordination.
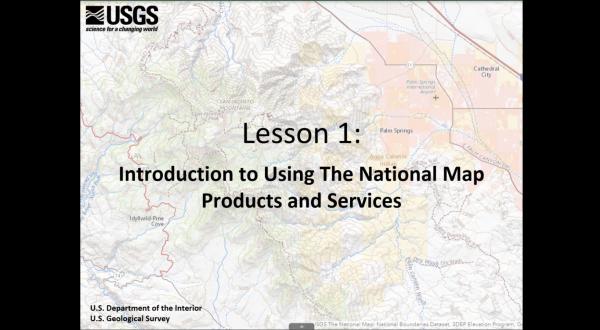
Welcome to the USGS course on Using The National Map Products and Services. This series of videos is focused on The National Map and the variety of products and services that it provides.
Surface Water Modeling for FEMA Flood Insurance Rate Maps.
Hydrologic Technician Brendan McCarthy and Alex Butcher set up a total station near a covered bridge on the Housatonic River in Connecticut.
A crew of two teams worked on measuring structures and channel cross sections along a reach of the Housatonic River.
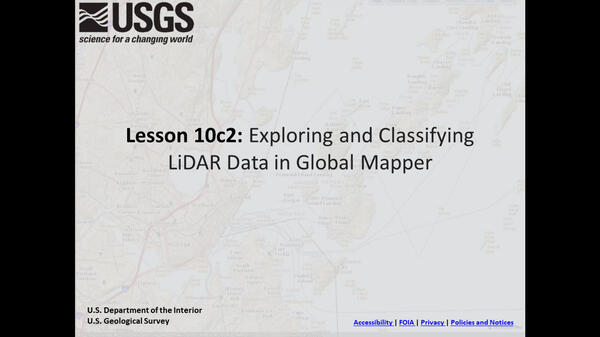
This lesson will cover additional LiDAR point cloud processing and analysis features in Global Mapper.
Surface Water Modeling for FEMA Flood Insurance Rate Maps.
USGS employee uses Collector App to locate the survey site.
Surface Water Modeling for FEMA Flood Insurance Rate Maps.
USGS employee uses Collector App to locate the survey site.
Surface Water Modeling for FEMA Flood Insurance Rate Maps.
USGS employee using survey data to model water surface elevation for different storm events.
Surface Water Modeling for FEMA Flood Insurance Rate Maps.
USGS employee using survey data to model water surface elevation for different storm events.
Surface Water Modeling for FEMA Flood Insurance Rate Maps.
USGS employees carry survey equipment to the survey site. They are hiking down a grassy hill in a farmers field in Connecticut.
Surface Water Modeling for FEMA Flood Insurance Rate Maps.
USGS employees carry survey equipment to the survey site. They are hiking down a grassy hill in a farmers field in Connecticut.
Surface Water Modeling for FEMA Flood Insurance Rate Maps.
USGS employees are setting up a total station near an old factory in preparation of taking a channel measurement.
Surface Water Modeling for FEMA Flood Insurance Rate Maps.
USGS employees are setting up a total station near an old factory in preparation of taking a channel measurement.
Surface Water Modeling for FEMA Flood Insurance Rate Maps.
USGS employees are setting up a total station on the edge of a field in preparation to make a channel measurement.
Surface Water Modeling for FEMA Flood Insurance Rate Maps.
USGS employees are setting up a total station on the edge of a field in preparation to make a channel measurement.
FEMA Flood Insurance Rate Maps.
USGS employee is checking Preliminary Flood Insurance Rate Maps before a meeting.
FEMA Flood Insurance Rate Maps.
USGS employee is checking Preliminary Flood Insurance Rate Maps before a meeting.
Surface Water Modeling for FEMA Flood Insurance Rate Maps.
USGS employees survey a bridge.
Surface Water Modeling for FEMA Flood Insurance Rate Maps.
USGS employees survey a bridge.
This lesson will provide a brief overview of the National Hydrography Dataset (NHD), describe what features make up NHD, show how NHD functions as a national hydrographic network, and provide information on accessing data and additional resources.
The Androscoggin river in Maine during Fall colors.
Science and Products
Documentation and mapping of flooding from the January and March 2018 nor’easters in coastal New England
In January and March 2018, coastal Massachusetts experienced flooding from two separate nor’easters. To put the January and March floods into historical context, the USGS computed statistical stillwater elevations. Stillwater elevations recorded in January 2018 in Boston (9.66 feet relative to the North American Vertical Datum of 1988) have an annual exceedance probability of between 2 and 1 perce
Flood Documentation and Inundation Mapping of the January and March 2018 Nor’easters in Coastal Massachusetts
Data and shapefiles used to document the floods associated with the January and March 2018 Nor'easters for Coastal Areas of New England (ver. 2.0, November 2021)
The USGS Storm Event dashboard allows users to interact with and visualize high-water mark and storm sensor data points, and estimated flood extents from the January and March 2018 Nor’easter storm events. Users can also view the USGS 100-year Stillwater analysisand compare these flood extents to the current FEMA national flood hazard layers.
This lesson will cover Stream Flow Estimates in NHDPlus High Resolution. Enhanced Runoff Method, or EROM is the method used to compute estimates of the mean annual flow for the NHDPlus flowline features in the NHDPlus HR network.
Surface Water Modeling for FEMA Flood Insurance Rate Maps.
USGS employee in a canoe hold a prism and survey rod level while the channel point is collected with a total station from shore.
Surface Water Modeling for FEMA Flood Insurance Rate Maps.
USGS employee in a canoe hold a prism and survey rod level while the channel point is collected with a total station from shore.
Surface Water Modeling for FEMA Flood Insurance Rate Maps.
Hydrologic Technician Gunther Schletter takes a channel measurement using a Total Station on a river near St. Johnsbury, VT.
Surface Water Modeling for FEMA Flood Insurance Rate Maps.
Hydrologic Technician Gunther Schletter takes a channel measurement using a Total Station on a river near St. Johnsbury, VT.
In this lesson we will examine a brief history of the USGS topographic map, Introduce US Topo maps and their content, discuss the production and future goals of US Topo, and learn how to access these maps for viewing or printing.
By the end of this lesson, you will understand the difference between the LAS and LAZ format, know where to download the laszip.exe tool, and how to decompress a LAZ file to a LAS file using laszip.exe. The USGS offers other lessons on using LAS files in ArcGIS Pro, Global Mapper, and LP360.
In this lesson you will learn how to zoom to your area of interest and view the footprints of existing and proposed topographic lidar projects.
In this lesson you will learn how to use the USGS areas of interest project collection tool to add your lidar project to the Seasketch Demonstration Site for Federal Mapping Data Acquisition Coordination.
In this lesson you will learn how use the public areas of interest project collection tool to add your lidar project to the Seasketch Demonstration Site for Federal Mapping Data Acquisition Coordination.
Welcome to the USGS course on Using The National Map Products and Services. This series of videos is focused on The National Map and the variety of products and services that it provides.
Surface Water Modeling for FEMA Flood Insurance Rate Maps.
Hydrologic Technician Brendan McCarthy and Alex Butcher set up a total station near a covered bridge on the Housatonic River in Connecticut.
A crew of two teams worked on measuring structures and channel cross sections along a reach of the Housatonic River.
Surface Water Modeling for FEMA Flood Insurance Rate Maps.
Hydrologic Technician Brendan McCarthy and Alex Butcher set up a total station near a covered bridge on the Housatonic River in Connecticut.
A crew of two teams worked on measuring structures and channel cross sections along a reach of the Housatonic River.
This lesson will cover additional LiDAR point cloud processing and analysis features in Global Mapper.
Surface Water Modeling for FEMA Flood Insurance Rate Maps.
USGS employee uses Collector App to locate the survey site.
Surface Water Modeling for FEMA Flood Insurance Rate Maps.
USGS employee uses Collector App to locate the survey site.
Surface Water Modeling for FEMA Flood Insurance Rate Maps.
USGS employee using survey data to model water surface elevation for different storm events.
Surface Water Modeling for FEMA Flood Insurance Rate Maps.
USGS employee using survey data to model water surface elevation for different storm events.
Surface Water Modeling for FEMA Flood Insurance Rate Maps.
USGS employees carry survey equipment to the survey site. They are hiking down a grassy hill in a farmers field in Connecticut.
Surface Water Modeling for FEMA Flood Insurance Rate Maps.
USGS employees carry survey equipment to the survey site. They are hiking down a grassy hill in a farmers field in Connecticut.
Surface Water Modeling for FEMA Flood Insurance Rate Maps.
USGS employees are setting up a total station near an old factory in preparation of taking a channel measurement.
Surface Water Modeling for FEMA Flood Insurance Rate Maps.
USGS employees are setting up a total station near an old factory in preparation of taking a channel measurement.
Surface Water Modeling for FEMA Flood Insurance Rate Maps.
USGS employees are setting up a total station on the edge of a field in preparation to make a channel measurement.
Surface Water Modeling for FEMA Flood Insurance Rate Maps.
USGS employees are setting up a total station on the edge of a field in preparation to make a channel measurement.
FEMA Flood Insurance Rate Maps.
USGS employee is checking Preliminary Flood Insurance Rate Maps before a meeting.
FEMA Flood Insurance Rate Maps.
USGS employee is checking Preliminary Flood Insurance Rate Maps before a meeting.
Surface Water Modeling for FEMA Flood Insurance Rate Maps.
USGS employees survey a bridge.
Surface Water Modeling for FEMA Flood Insurance Rate Maps.
USGS employees survey a bridge.
This lesson will provide a brief overview of the National Hydrography Dataset (NHD), describe what features make up NHD, show how NHD functions as a national hydrographic network, and provide information on accessing data and additional resources.
The Androscoggin river in Maine during Fall colors.