Central Plateau Member rhyolite flow structures from the Yellowstone Plateau Volcanic Field
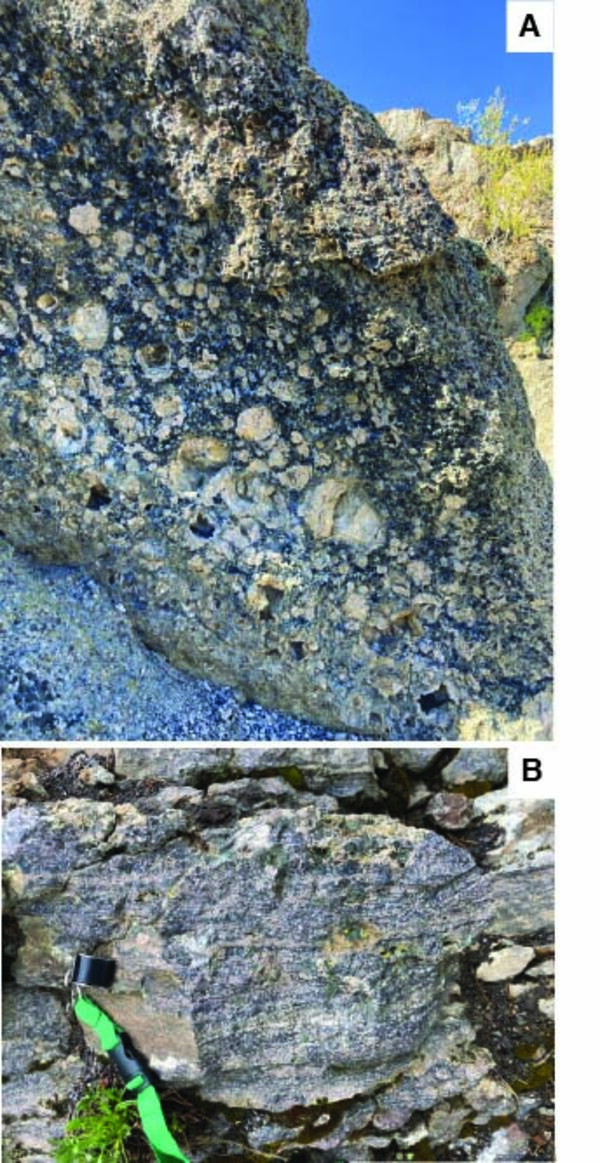
Central Plateau Member rhyolite flow structures from the Yellowstone Plateau Volcanic FieldPhotos of Central Plateau Member rhyolite flow structures from the Yellowstone Plateau Volcanic Field. A) An ogive from a road cut along Firehole Lake Drive. Ogives are pressure ridges that form perpendicular to the direction of flow from the compressive stresses that deform the highly viscous lava as it moves.