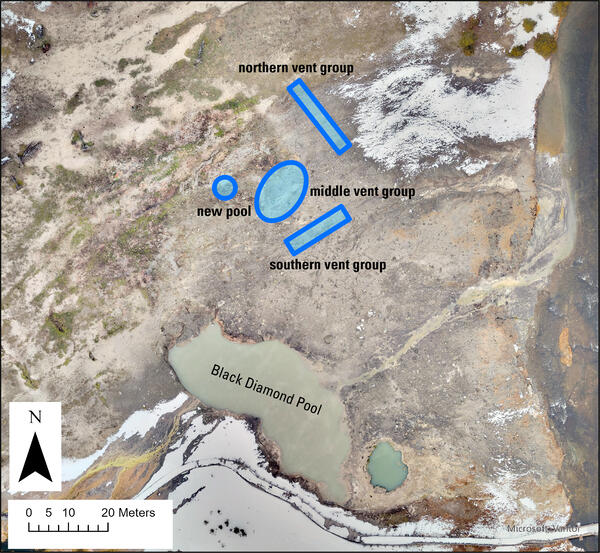
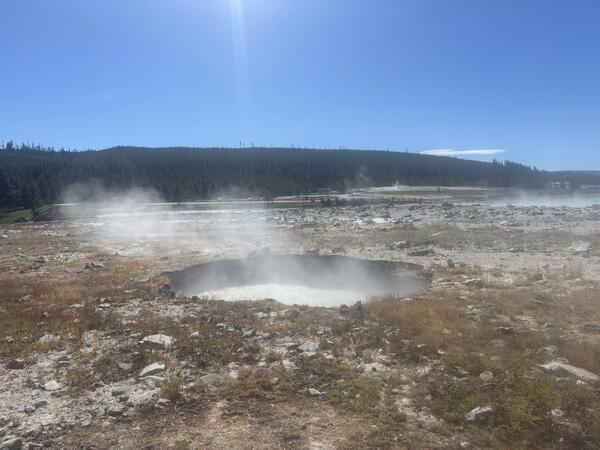
U.S. flag

An official website of the United States government

Images

Images of Yellowstone.

Filter Total Items: 449
Plots showing the number of water samples collected over time (top) and by location (bottom) in the Yellowstone region since the late 1800s

Plots showing the number of water samples collected over time (top) and by location (bottom) in the Yellowstone region since the late 1800s. Yellowstone’s archive of water-chemistry research data is a mosaic of scientific progress, built with the work of hundreds of people over more than a century and still growing today.

Plots showing the number of water samples collected over time (top) and by location (bottom) in the Yellowstone region since the late 1800s. Yellowstone’s archive of water-chemistry research data is a mosaic of scientific progress, built with the work of hundreds of people over more than a century and still growing today.

Schematic illustrating the conditions under which some travertine forms in Yellowstone caldera

Schematic illustrating the conditions under which some travertine forms in Yellowstone caldera.

History of travertine deposition in Yellowstone caldera and correlation with past climate conditions

History of travertine deposition in Yellowstone caldera and correlation with past climate conditions. a) The age of travertine samples (based on the U-230Th geochronometer) from Old Hillside Springs, Hillside Springs, North Hillside Springs, and Morning Glory in Upper Geyser Basin and from Firehole Lake in Lower Geyser Basin.

History of travertine deposition in Yellowstone caldera and correlation with past climate conditions. a) The age of travertine samples (based on the U-230Th geochronometer) from Old Hillside Springs, Hillside Springs, North Hillside Springs, and Morning Glory in Upper Geyser Basin and from Firehole Lake in Lower Geyser Basin.

Schematic of the Huckleberry Ridge Tuff magma storage configuration

Schematic of the Huckleberry Ridge Tuff magma storage configuration, consisting of discrete batches of magma. Analyzing the compositions of melt inclusions can help paint this type of big picture of the magmatic system. Figure modified from Myers et al. (2016).

Schematic of the Huckleberry Ridge Tuff magma storage configuration, consisting of discrete batches of magma. Analyzing the compositions of melt inclusions can help paint this type of big picture of the magmatic system. Figure modified from Myers et al. (2016).

Melt inclusions in a quartz crystal from the Huckleberry Ridge Tuff

Melt inclusions (<50 micrometers in diameter) in a quartz crystal from the Huckleberry Ridge Tuff, erupted 2.1 million years ago. Photomicrograph taken by Behnaz Hosseini at Montana State University.

Melt inclusions (<50 micrometers in diameter) in a quartz crystal from the Huckleberry Ridge Tuff, erupted 2.1 million years ago. Photomicrograph taken by Behnaz Hosseini at Montana State University.

Illustration of the crystal growth process that leads to melt inclusion entrapment

Illustration of the crystal growth process that leads to melt inclusion entrapment. (a) A crystal (gray area) nucleates and grows. (b) As the magma cools, the crystal corners will grow more efficiently than crystal edges. (c) This growth process will lead to the entrapment of surrounding melt (orange area).

Illustration of the crystal growth process that leads to melt inclusion entrapment. (a) A crystal (gray area) nucleates and grows. (b) As the magma cools, the crystal corners will grow more efficiently than crystal edges. (c) This growth process will lead to the entrapment of surrounding melt (orange area).

Map of the locations of water samples collected in and around Yellowstone National Park, 1883-2021

Map of the locations of water samples collected in and around Yellowstone National Park and detailed in the USGS Data Release "Historic Water Chemistry Data for Thermal Features, Streams, and Rivers in the Yellowstone National Park Area, 1883-2021." Colors indicate type of water sample.

Map of Yellowstone earthquakes that were located during 1973-2023

Map of Yellowstone earthquakes that were located during 1973-2023. Red circles are earthquakes located in the Yellowstone region, and blue circles indicate swarm seismicity.  The size of the circle scales with the magnitude of the earthquake.

Map of Yellowstone earthquakes that were located during 1973-2023. Red circles are earthquakes located in the Yellowstone region, and blue circles indicate swarm seismicity.  The size of the circle scales with the magnitude of the earthquake.

Histogram of Yellowstone earthquakes during 1973-2023

Histogram showing the number of earthquakes per 3-month period (quarter) in the Yellowstone region during 1973–2023.  Red bars represent all earthquakes located in the area, and blue bars indicate swarm seismicity.

Histogram showing the number of earthquakes per 3-month period (quarter) in the Yellowstone region during 1973–2023.  Red bars represent all earthquakes located in the area, and blue bars indicate swarm seismicity.

Vertical motion at GPS station P720, near the Slough Creek Campground in the northeast part of Yellowstone National Park

Vertical motion at GPS station P720, near the Slough Creek Campground in the northeast part of Yellowstone National Park, clearly shows a large annual cycle.

Hydrograph showing discharge in cubic feet per second for Corwin Springs streamgage site on the Yellowstone River, MT, spanning 1889-2023

Hydrograph showing discharge in cubic feet per second for Corwin Springs streamgage site on the Yellowstone River, MT, spanning 1889-2023.  The spike in 2022 is from the June floods of that year.

Plot of specific conductance, discharge, and temperature measured at the Yellowstone River at Corwin Springs, MT, in early-mid 2023

Plot of specific conductance, discharge, and temperature measured at the Yellowstone River at Corwin Springs, Montana, during early-mid 2023. The anomalous spikes in temperature and specific conductance on May 23, 2023, are thought to be when a large sand and bar was deposited at the site. May 23 is also the peak flow in 2023.

Plot of specific conductance, discharge, and temperature measured at the Yellowstone River at Corwin Springs, Montana, during early-mid 2023. The anomalous spikes in temperature and specific conductance on May 23, 2023, are thought to be when a large sand and bar was deposited at the site. May 23 is also the peak flow in 2023.

Map of earthquakes in the Yellowstone National Park region in 2023

Map of seismicity (red circles) in the Yellowstone region during 2023. Gray lines are roads, black dashed line shows the caldera boundary, Yellowstone National Park is outlined by black dot-dashed line, and gray dashed lines denote state boundaries.

Map of seismicity (red circles) in the Yellowstone region during 2023. Gray lines are roads, black dashed line shows the caldera boundary, Yellowstone National Park is outlined by black dot-dashed line, and gray dashed lines denote state boundaries.

Infrasound data from Norris Geyser Basin showing November 13, 2023, eruption of Steamboat Geyser

Infrasound-array processing for the newly installed station YNB, at Norris Geyser Basin. Top panel shows the pressure waveform from one of the three elements that comprise the array, filtered between 1 and 15 Hz. Bottom panel shows the backazimuth from the station to the source.

Infrasound-array processing for the newly installed station YNB, at Norris Geyser Basin. Top panel shows the pressure waveform from one of the three elements that comprise the array, filtered between 1 and 15 Hz. Bottom panel shows the backazimuth from the station to the source.

Thermal imagery from near Beryl Spring, Yellowstone National Park, showing heat from a buried pipe

Thermal imagery from near Beryl Spring showing heat from a buried pipe that vents steam from the concrete containment box built in1962 around a spring that opened in the adjacent roadbed in 1942. National Park Service photo by Erin Dundas, November 8, 2023.

Thermal imagery from near Beryl Spring showing heat from a buried pipe that vents steam from the concrete containment box built in1962 around a spring that opened in the adjacent roadbed in 1942. National Park Service photo by Erin Dundas, November 8, 2023.

Flagg Ranch exposure of the Lava Creek Tuff

Flagg Ranch exposure showing lower unknown ignimbrite (ash flow), the Lava Creek Tuff (LCT) ash fall deposit, and upper ignimbrite of the LCT. Thanks to work by Montana State University geologists, it is now known that the unknown ignimbrite was deposited immediately prior to the ash fall, with no significant time gap in between.

Flagg Ranch exposure showing lower unknown ignimbrite (ash flow), the Lava Creek Tuff (LCT) ash fall deposit, and upper ignimbrite of the LCT. Thanks to work by Montana State University geologists, it is now known that the unknown ignimbrite was deposited immediately prior to the ash fall, with no significant time gap in between.

Flagg Ranch exposure of the Lava Creek Tuff with quartz-hosted melt inclusions

Photo of ash-fall deposit of the Lava Creek Tuff overlying the lower “unknown” ignimbrite (an ash-flow unit, denoted by light yellow box).  Images of quartz-hosted melt inclusions show fully “baked” (dark) melt inclusions in the lowest ash fall layers (1–2).

Photo of ash-fall deposit of the Lava Creek Tuff overlying the lower “unknown” ignimbrite (an ash-flow unit, denoted by light yellow box).  Images of quartz-hosted melt inclusions show fully “baked” (dark) melt inclusions in the lowest ash fall layers (1–2).

Shaded relief maps based on lidar data and showing fault scarps in Paradise Valley, Montana

Shaded relief maps based on lidar data and showing fault scarps in Paradise Valley, Montana.  Lidar imagery is given as a colored, shaded slope map, with higher elevations in brown and white, and lower elevations in green. Darker shading indicates steeper slopes. Top image is a northwestward view (toward Livingston) of Paradise Valley near Carbella.

Shaded relief maps based on lidar data and showing fault scarps in Paradise Valley, Montana.  Lidar imagery is given as a colored, shaded slope map, with higher elevations in brown and white, and lower elevations in green. Darker shading indicates steeper slopes. Top image is a northwestward view (toward Livingston) of Paradise Valley near Carbella.

Shaded relief maps based on lidar data and showing landslides in the area of Yankee Jim Canyon, Montana

Shaded relief maps based on lidar data and showing landslides in the area of Yankee Jim Canyon, Montana. Lidar imagery is given as a colored, shaded slope map, with higher elevations in brown and white, and lower elevations in green. Darker shading indicates steeper slopes.

Shaded relief maps based on lidar data and showing landslides in the area of Yankee Jim Canyon, Montana. Lidar imagery is given as a colored, shaded slope map, with higher elevations in brown and white, and lower elevations in green. Darker shading indicates steeper slopes.

Regional shaded relief map of the Eastern Snake River Plain

Regional shaded relief map of the Eastern Snake River Plain (ESRP). The map highlights the low relief terrain of the ESRP and the dramatic rhyolite domes that punctuate it. Map by Zach Lifton, Idaho Geological Survey.

Regional shaded relief map of the Eastern Snake River Plain (ESRP). The map highlights the low relief terrain of the ESRP and the dramatic rhyolite domes that punctuate it. Map by Zach Lifton, Idaho Geological Survey.

River levels and vertical deformation of Yellowstone caldera during 2016–2022

River levels and vertical deformation of Yellowstone caldera during 2016–2022.  River level (blue) was measured at the Corwin Springs gaging station on the Yellowstone River, just north of Yellowstone National Park.  Vertical deformation (red) is from the WLWY GPS station on the east side of Yellowstone caldera.  The GPS data indicate overall subsiden

River levels and vertical deformation of Yellowstone caldera during 2016–2022.  River level (blue) was measured at the Corwin Springs gaging station on the Yellowstone River, just north of Yellowstone National Park.  Vertical deformation (red) is from the WLWY GPS station on the east side of Yellowstone caldera.  The GPS data indicate overall subsiden